Practice finding conditional probabilities, using two-way tables and tree diagrams, and applying Bayes' theorem to real-world situations.
Read each problem carefully. Show your work in the space provided. Round decimal answers to the nearest thousandth or percent answers to the nearest tenth of a percent unless the problem says otherwise.
Using conditional probability, tables, trees, and Bayes' theorem
Statistics - Grade 9-12
- 1
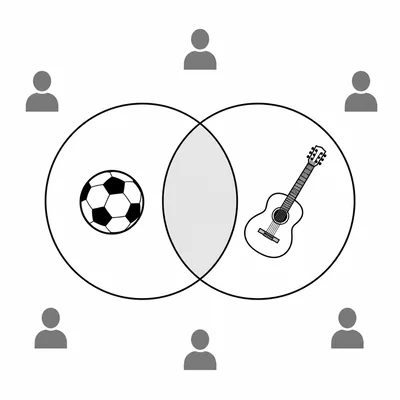
A survey of 200 students found that 120 play a sport, 80 play an instrument, and 45 play both a sport and an instrument. If a student is chosen at random, what is the probability that the student plays an instrument given that the student plays a sport?
- 2
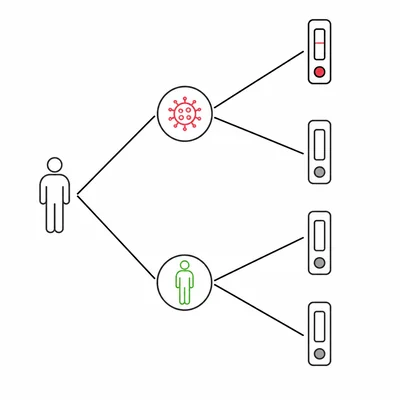
A medical test is used to screen for a condition. The condition affects 2% of the population. The test correctly gives a positive result for 95% of people who have the condition, and it gives a false positive result for 8% of people who do not have the condition. If a randomly selected person tests positive, what is the probability that the person actually has the condition?
- 3
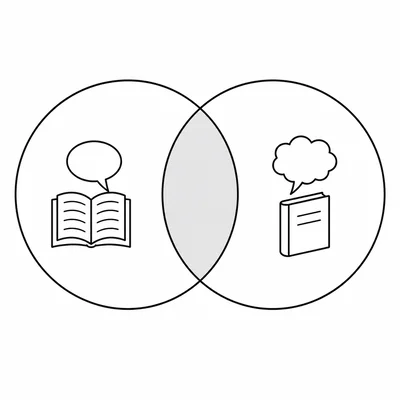
In a school, 55% of students take Spanish, 30% take French, and 12% take both Spanish and French. What is the probability that a randomly selected student takes French given that the student takes Spanish?
- 4
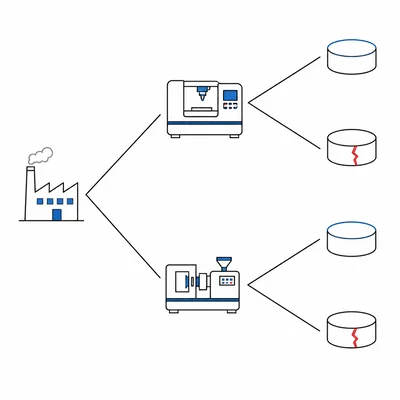
A factory has two machines. Machine A makes 70% of the products and has a defect rate of 3%. Machine B makes 30% of the products and has a defect rate of 6%. If a randomly selected product is defective, what is the probability that it came from Machine B?
- 5
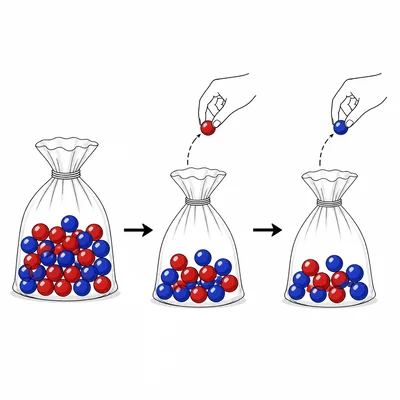
A bag contains 5 red marbles and 7 blue marbles. One marble is drawn and not replaced. Then a second marble is drawn. What is the probability that the second marble is blue given that the first marble was red?
- 6
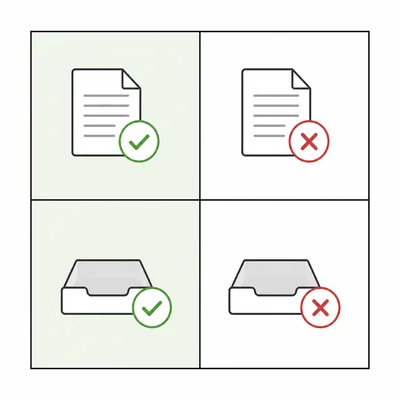
A two-way table shows the results of a class survey about homework completion and quiz success. Of 90 students, 50 completed the homework, 40 did not, 42 completed the homework and passed the quiz, and 18 did not complete the homework but passed the quiz. What is the probability that a student completed the homework given that the student passed the quiz?
- 7

Suppose P(A) = 0.40, P(B) = 0.25, and P(A and B) = 0.10. Find P(A given B) and P(B given A).
- 8
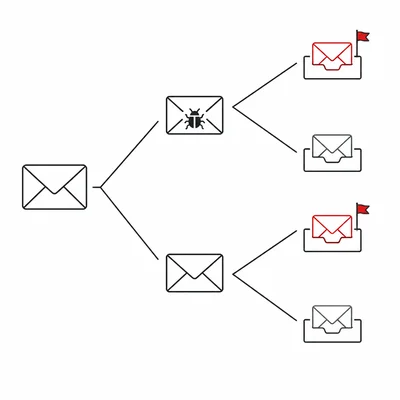
A spam filter marks 90% of spam emails as spam and incorrectly marks 4% of regular emails as spam. Suppose 20% of all emails are spam. If an email is marked as spam, what is the probability that it is actually spam?
- 9
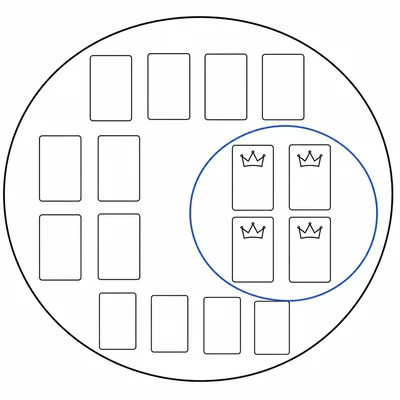
A card is drawn from a standard 52-card deck. Let A be the event that the card is a king, and let B be the event that the card is a face card. What is P(A given B)? Assume face cards are jacks, queens, and kings.
- 10
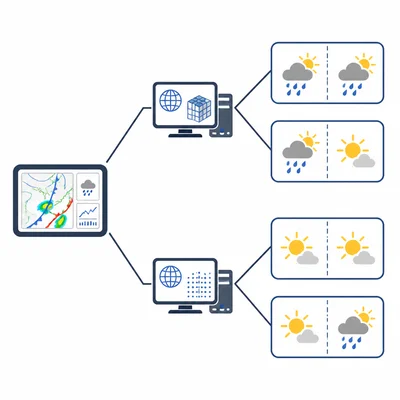
A city uses two weather models. Model X is used 60% of the time and is correct 80% of the time. Model Y is used 40% of the time and is correct 70% of the time. If a randomly selected forecast was correct, what is the probability that it came from Model X?
- 11
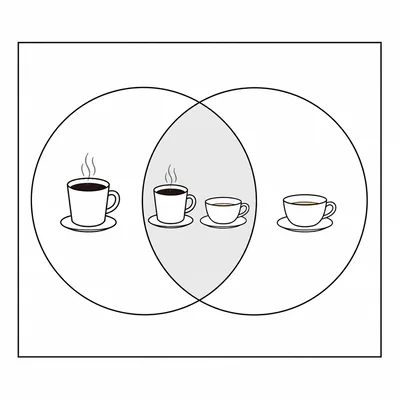
In a group of 150 people, 90 drink coffee, 60 drink tea, and 30 drink both coffee and tea. Are the events drinking coffee and drinking tea independent? Explain using probabilities.
- 12
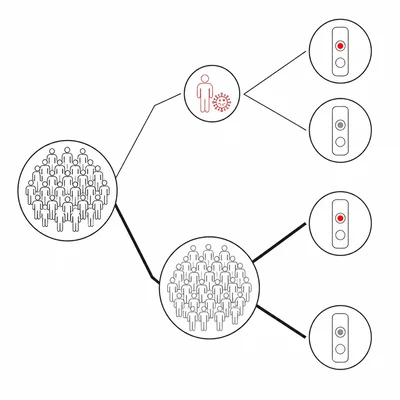
A rare condition affects 1 in 500 people. A test has a sensitivity of 99%, meaning it is positive for 99% of people with the condition. It has a specificity of 97%, meaning it is negative for 97% of people without the condition. If a person tests positive, what is the probability that the person has the condition?
- 13
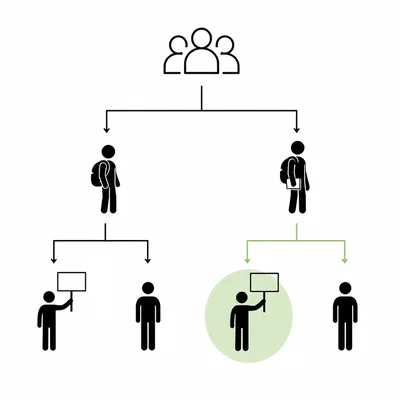
A club has 40 members. There are 24 juniors and 16 seniors. Of the juniors, 15 volunteer at an event. Of the seniors, 12 volunteer at the event. If a club member is selected at random and is known to have volunteered, what is the probability that the member is a senior?
- 14

A website has visitors from phones and computers. 65% of visitors use phones, and 35% use computers. Of phone users, 8% make a purchase. Of computer users, 12% make a purchase. What is the probability that a randomly selected visitor made a purchase?
- 15

Using the website information from the previous problem, if a randomly selected visitor made a purchase, what is the probability that the visitor used a computer?