Practice calculating z-scores, interpreting standardized values, using the empirical rule, and estimating probabilities from the normal distribution.
Read each problem carefully. Show your work and round z-scores to the nearest hundredth when needed. Use a standard normal table or calculator for probability questions.
Using z-scores to compare values and estimate normal probabilities
Statistics - Grade 9-12
- 1
A test has a mean score of 70 and a standard deviation of 8. A student scores 78. Calculate the student's z-score.
- 2
A set of quiz scores has a mean of 50 and a standard deviation of 4. A student's z-score is -1.50. What was the student's quiz score?
- 3
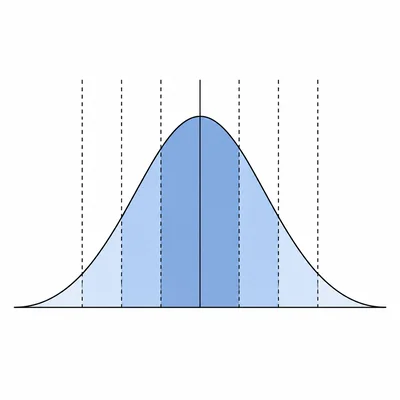
A normal distribution has a mean of 100 and a standard deviation of 15. Use the empirical rule to find the intervals that contain about 68%, 95%, and 99.7% of the data.
- 4
A data value has a z-score of -0.75. Explain what this means in context of a normal distribution.
- 5
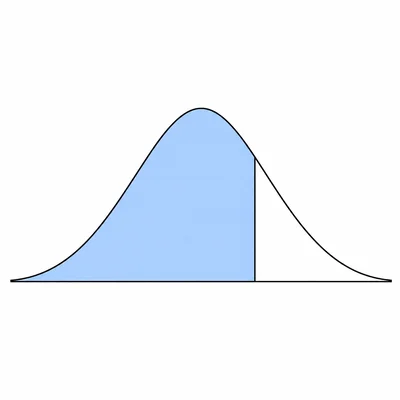
A standardized exam has a mean of 1050 and a standard deviation of 100. A student scores 1200. Find the z-score and estimate the student's percentile using a standard normal table.
- 6
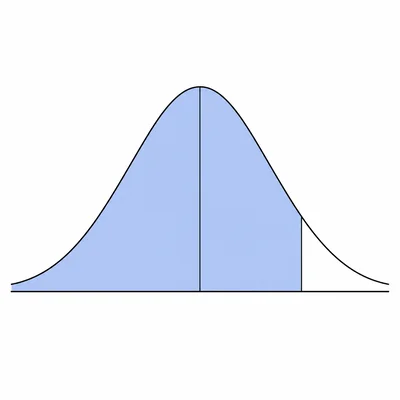
For a standard normal distribution, find P(Z < 0.84).
- 7
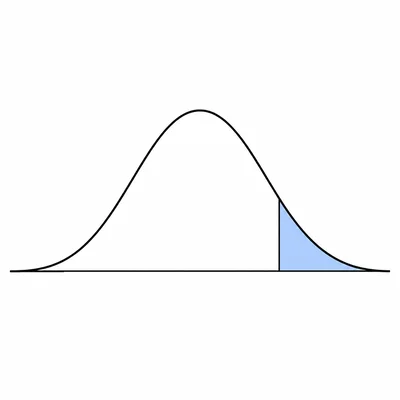
For a standard normal distribution, find P(Z > 1.25).
- 8
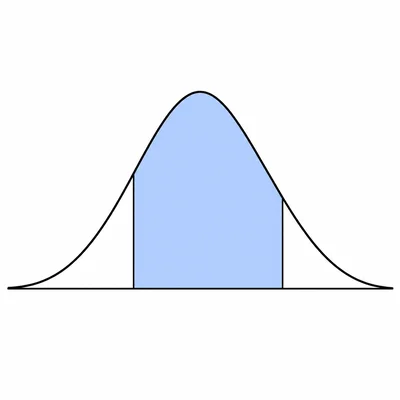
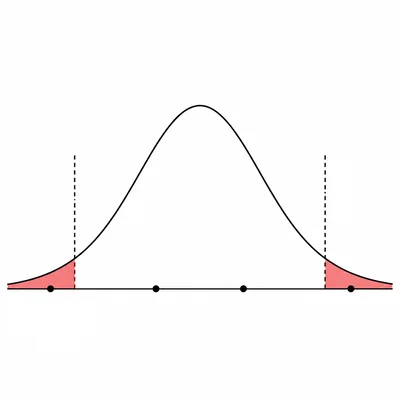
For a standard normal distribution, find P(-1.00 < Z < 1.50).
- 9
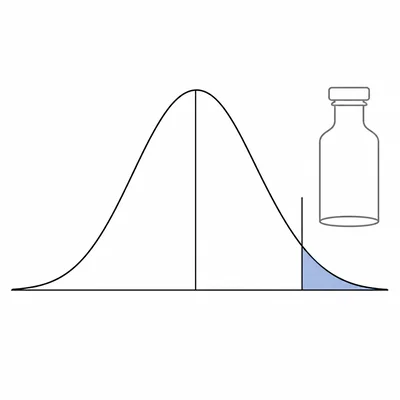
A machine fills bottles with a mean of 500 milliliters and a standard deviation of 80 milliliters. Assuming the amounts are normally distributed, what bottle amount marks the top 5%? Use z = 1.645 for the 95th percentile.
- 10
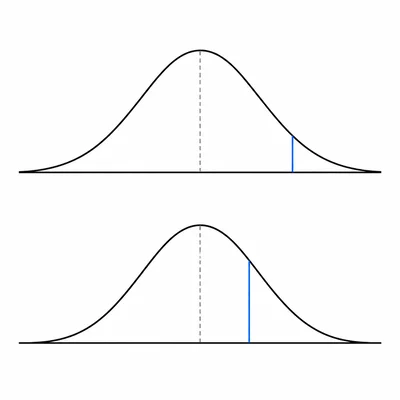
Student A scored 82 on a test with a class mean of 75 and a standard deviation of 5. Student B scored 88 on a different test with a class mean of 80 and a standard deviation of 10. Which student performed better relative to their class?
- 11
A normally distributed data set has a mean of 30 and a standard deviation of 4. The values 21, 25, 34, and 39 are observed. Using |z| > 2 as the rule for unusual values, which values are unusual?
- 12
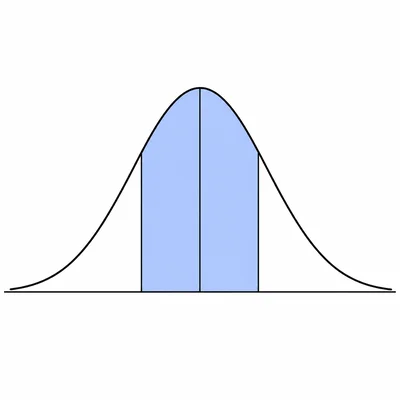
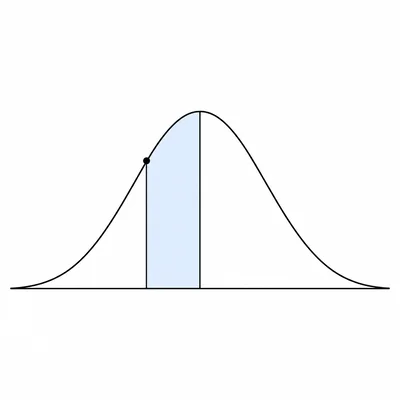
Orange weights are approximately normally distributed with a mean of 160 grams and a standard deviation of 12 grams. About what percent of oranges weigh between 148 grams and 172 grams?