Sign in to save

Bookmark this page so you can find it later.

Sign in to save

Bookmark this page so you can find it later.

Math high-school May 24, 2026

Why Can a Survey of 1000 People Predict an Election?

How random samples can stand in for millions
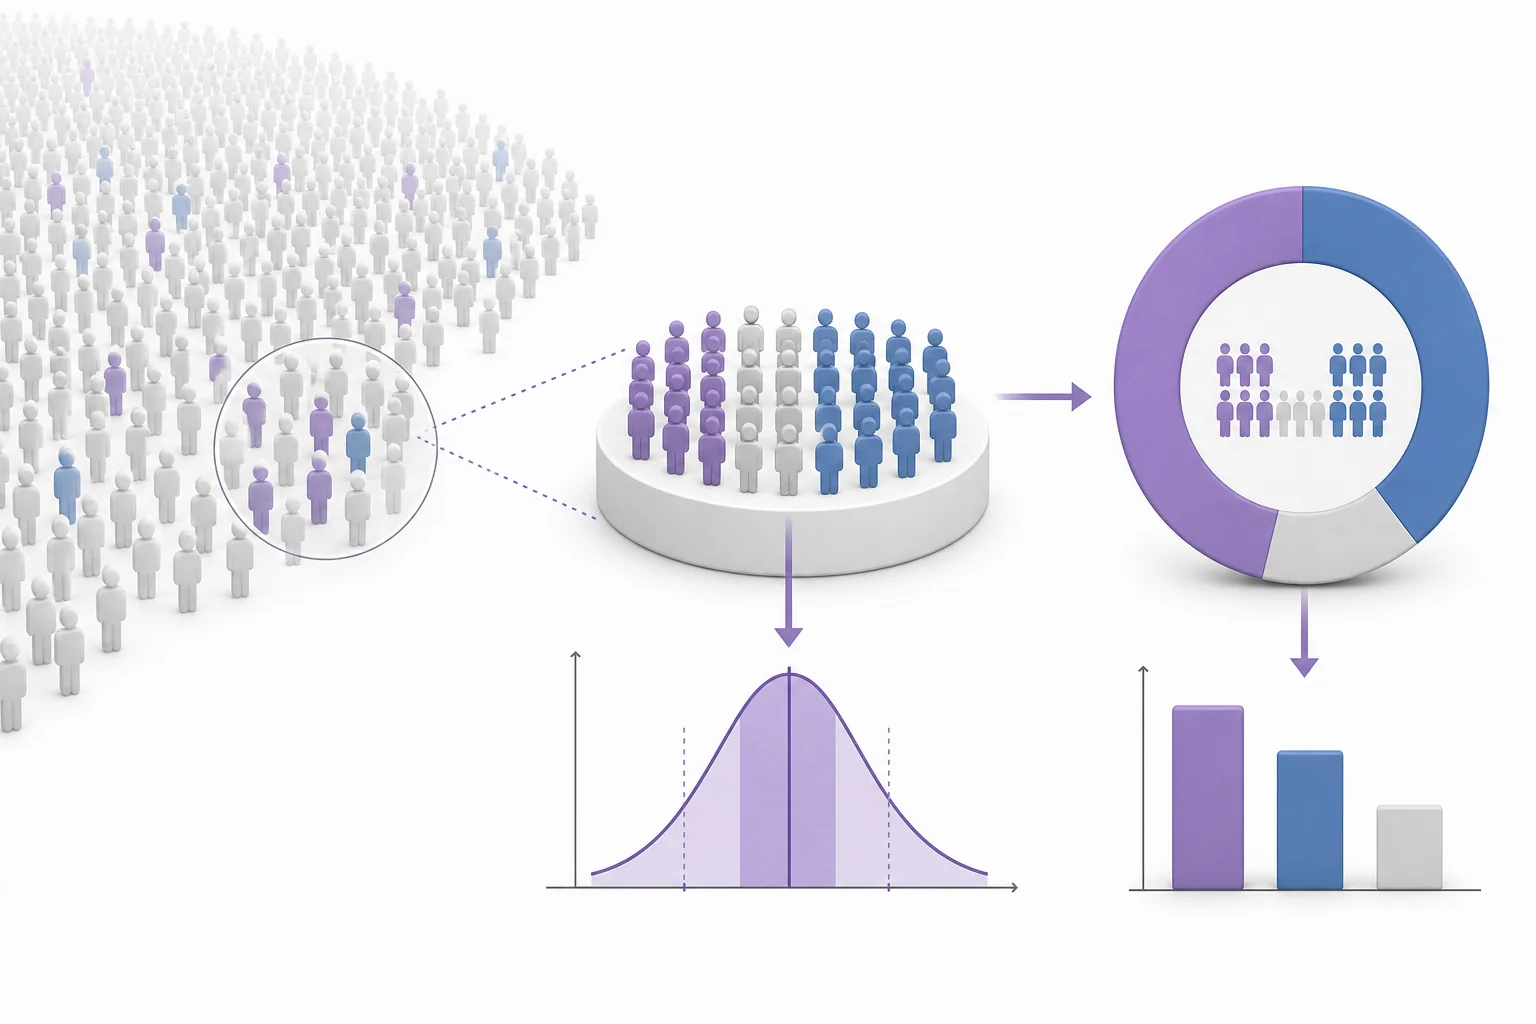
A random sample of voters shown as 1000 highlighted dots selected from a much larger field of dots representing an electorate

A survey can predict an election when the people in it are chosen randomly from the whole group of voters. Random choice helps the sample look like the larger population, even when the population is very large. A sample of 1000 people still has uncertainty, but that uncertainty can be estimated with a margin of error.

Big Idea. Common Core HSS.IC.B.4 asks students to use data from a sample survey to estimate a population proportion and describe the margin of error.

Election polls can feel surprising. A country may have more than 150 million voters, yet a poll of about 1000 people can give a useful estimate. The reason is not that 1000 is magic. The reason is random sampling. If every voter has a known chance of being chosen, the sample can act like a small model of the full electorate. Some groups will be a little high or low by chance, but those errors tend to balance out. Statistics gives us a way to measure how much wiggle room to expect. For a 95 percent confidence level, a common shortcut is $\text{margin of error} \approx \frac{1}{\sqrt{n}}$. With $n = 1000$, that is about 3 percentage points. This idea belongs to statistical inference. We use a smaller set of data to make a careful claim about a larger group.

A sample is a small model
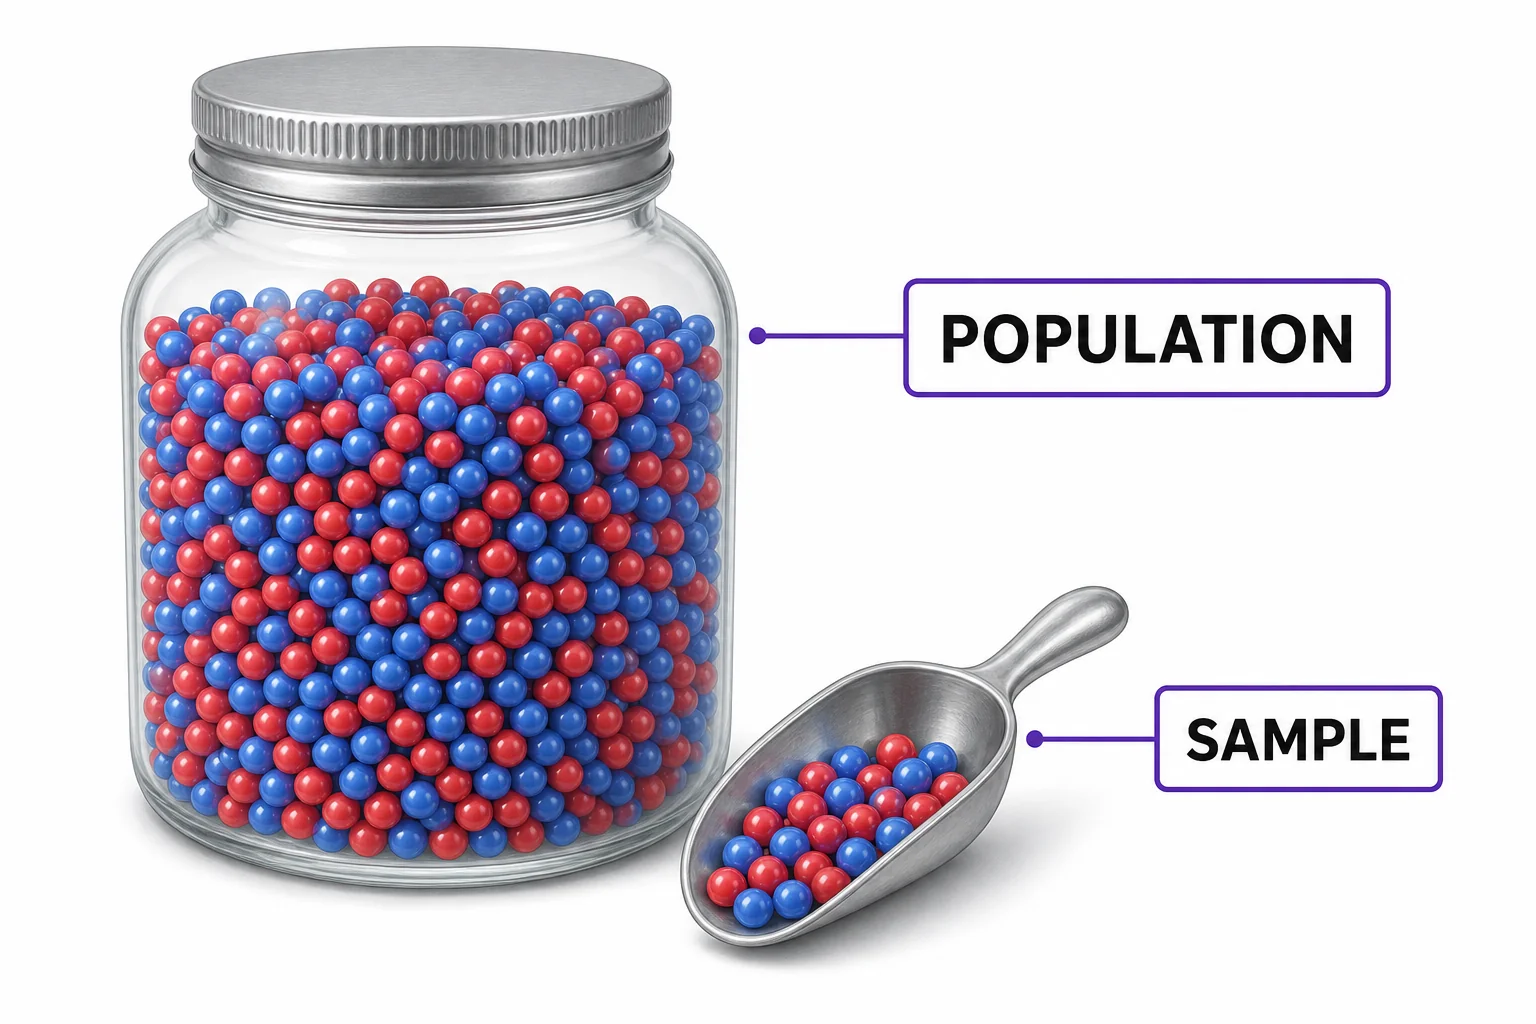
A large jar of mixed colored beads with a small scoop of beads beside it, showing how a random sample can reflect the larger group
A random sample works like a fair scoop from a mixed jar.
A survey does not need to ask everyone. It needs to ask a group that was selected in a fair way. Think of the electorate as a giant jar filled with beads. Each bead is one voter. If the jar is mixed well, a scoop can show the rough mix of colors in the whole jar. In an election poll, the colors might stand for candidate preference. A random sample is like the scoop. It does not copy the population perfectly. It gives an estimate. If 52 percent of the sample supports one candidate, the real population value might be a little higher or lower. The sample is useful because random selection makes large mistakes less likely. It also lets us calculate how large the usual error should be. That calculation is what turns a guess into a statistical estimate.

A good sample is chosen by the process, not by its size alone.

Random means no hidden pattern
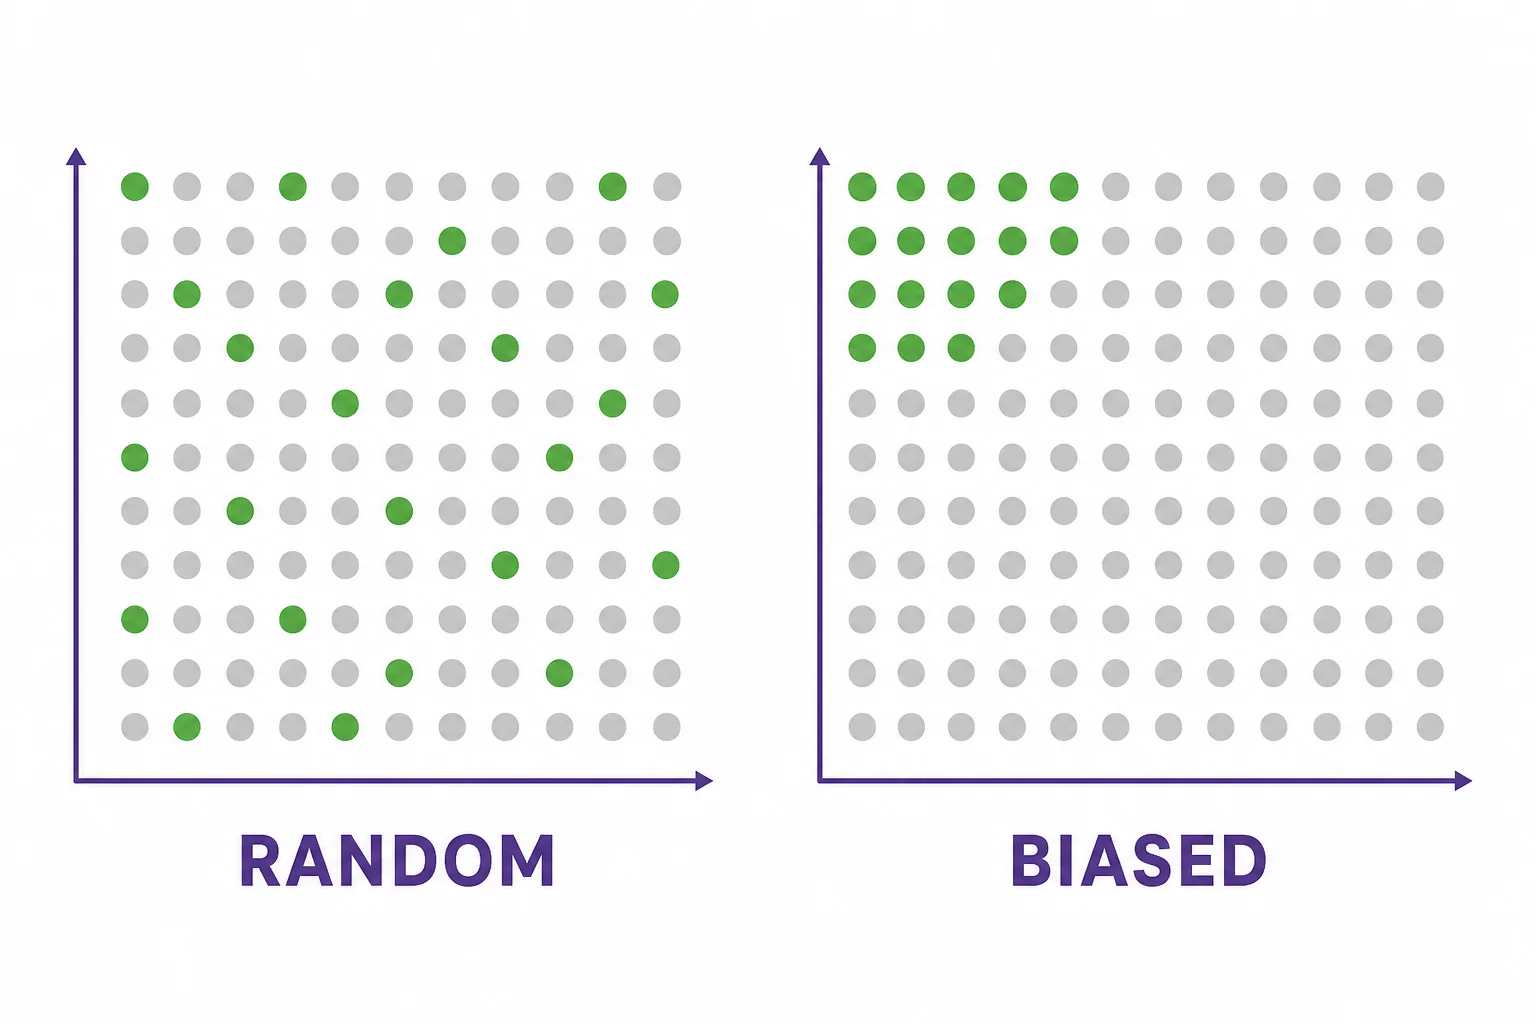
Two voter grids compared, one with dots chosen from many areas and one with dots chosen from only one corner
Random samples spread across the group. Biased samples cluster.
Random sampling means each person in the population has a known chance of being selected. This matters because biased samples can miss whole groups. A poll taken only outside one school, one workplace, or one website might overrepresent people who share the same age, location, or interests. A biased sample can be large and still wrong. Randomness helps break that hidden pattern. It spreads the sample across the population instead of letting the pollster choose convenient people. In real polling, perfect randomness is hard. Some people do not answer calls or messages. Some groups are harder to reach. Pollsters try to reduce these problems with careful sampling plans and weighting. Still, the main math idea stays the same. Random selection is what lets probability describe the likely error in a survey result.

A biased sample can be huge and still give the wrong answer.

Why 1000 is often enough
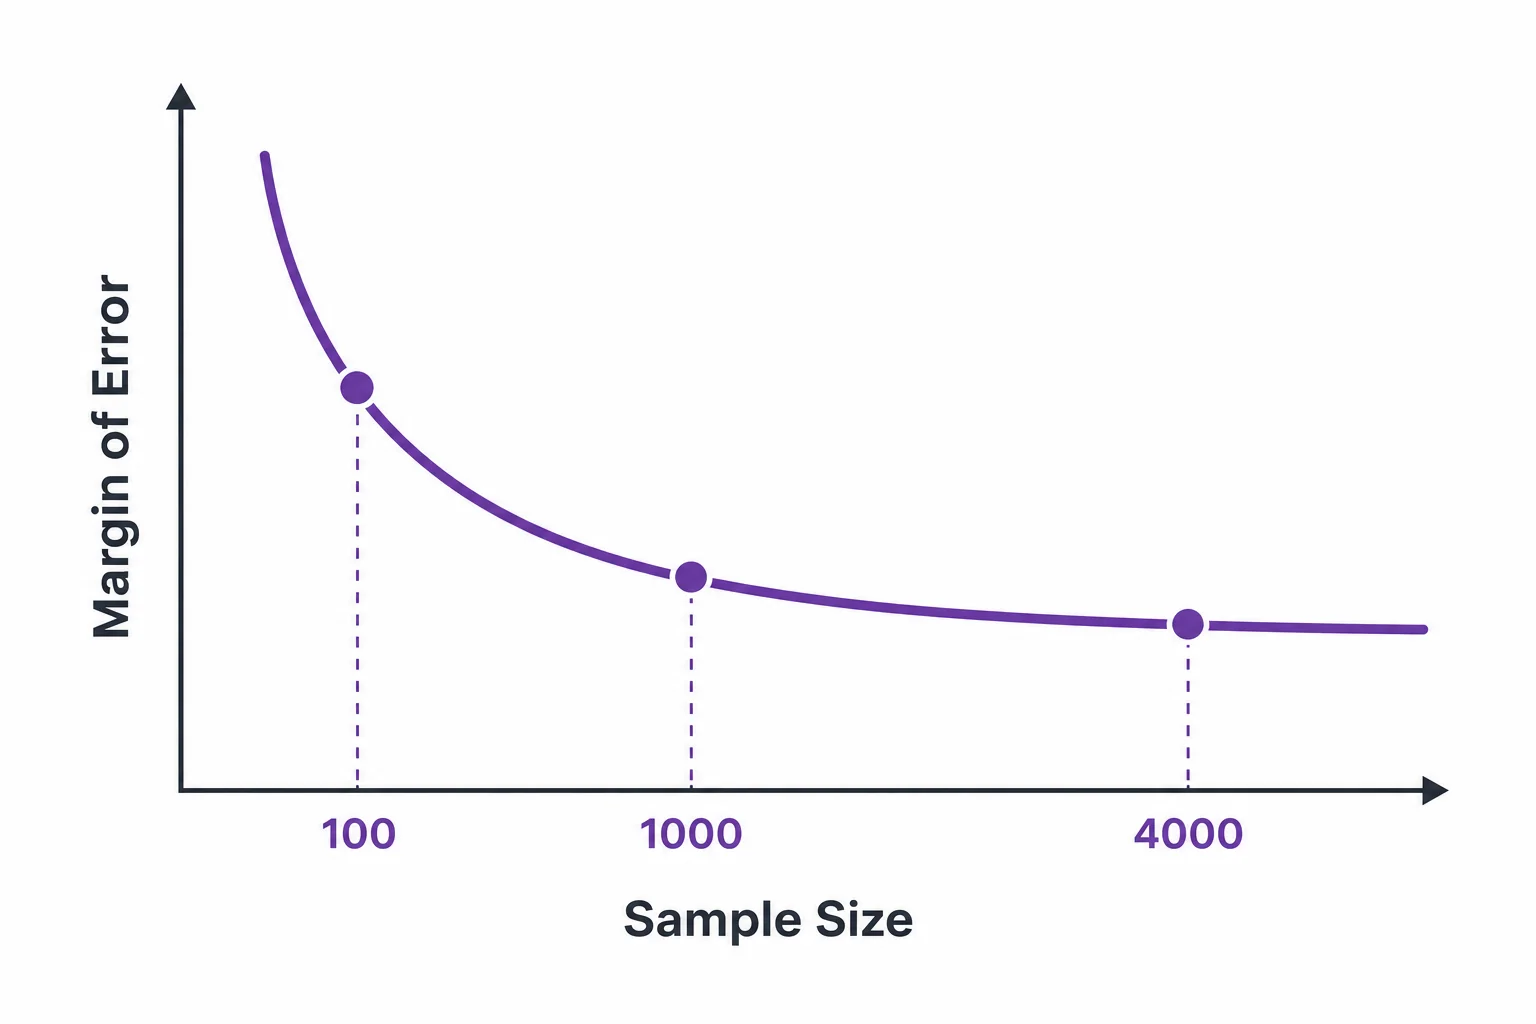
A graph showing margin of error decreasing as sample size increases, with points near 100, 1000, and 4000
Bigger samples help, but each extra person helps a little less.
The uncertainty in a poll depends mostly on the sample size, not the population size. That feels odd at first. A sample of 1000 voters can estimate a city, a state, or a large country with similar precision if the sampling is random. The key is how much random variation appears inside the sample. When the sample grows, that variation shrinks. It shrinks slowly, following a square root pattern. A sample four times larger cuts the margin of error about in half. That is why going from 1000 to 4000 helps, but it does not make the poll four times more precise. For proportions near 50 percent, the common 95 percent margin of error shortcut is about $\frac{1}{\sqrt{n}}$. For $n = 1000$, $\frac{1}{\sqrt{1000}}$ is about 0.032, or 3.2 percentage points.

Sample size matters more than population size for poll precision.

Margin of error is wiggle room
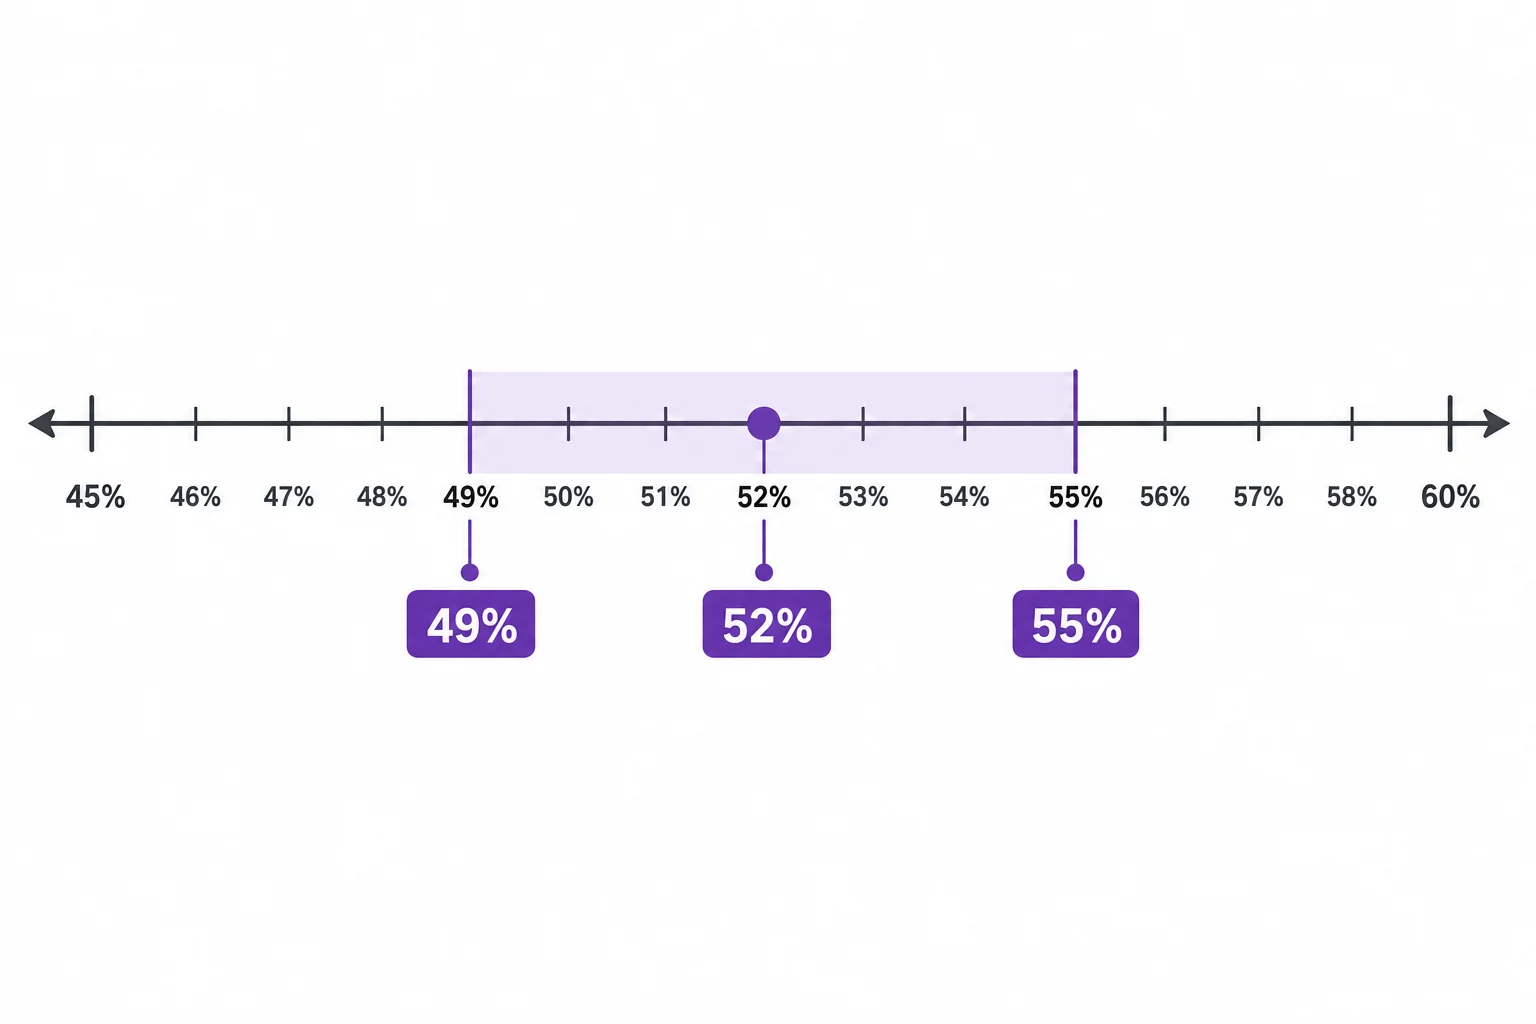
A number line showing a poll estimate of 52 percent with a shaded interval from 49 percent to 55 percent
A poll estimate comes with a range, not a single exact answer.
A poll result is an estimate, not an exact measurement. The margin of error gives a range of values that are reasonable because of random sampling. Suppose a poll of 1000 likely voters finds 52 percent for Candidate A. A margin of error of about 3 percentage points means the true support could plausibly be around 49 percent to 55 percent, if the poll was well designed. That range is not a promise. It only describes sampling error under the poll model. It does not include every possible problem, such as people changing their minds, unclear questions, nonresponse, or bad lists of voters. Still, the margin of error is useful. It reminds readers not to treat 52 percent as exact. In a close race, two candidates can be statistically tied even when one number looks slightly higher.

Close poll numbers can overlap once uncertainty is included.

Confidence is about the method
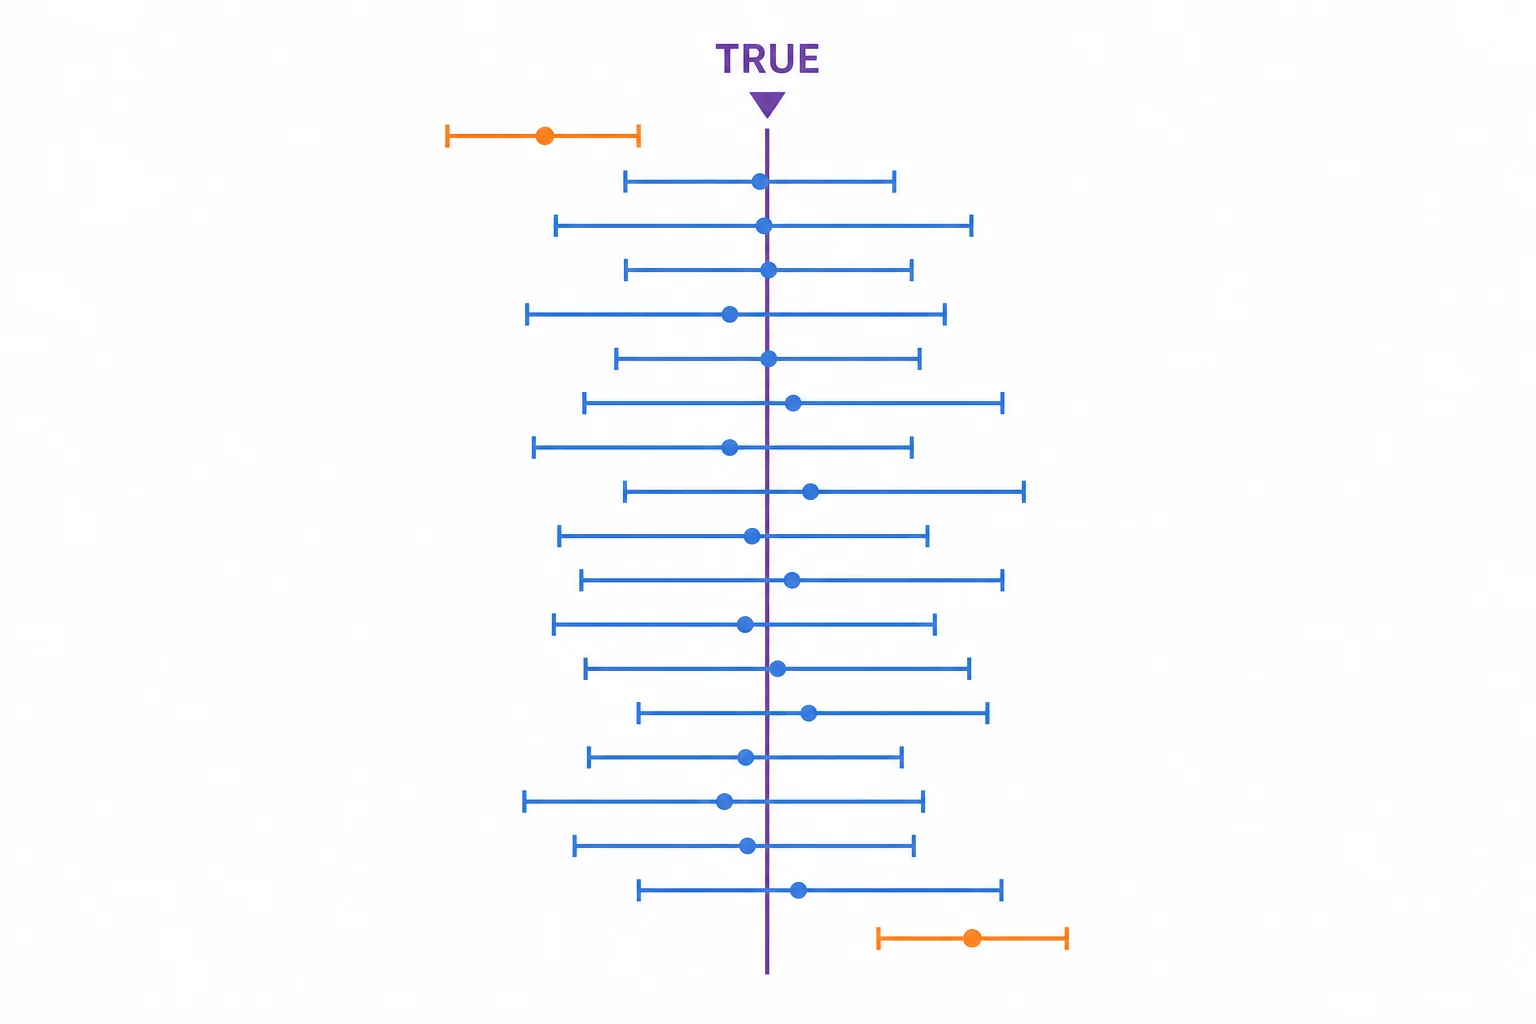
Many confidence intervals stacked vertically, most crossing a true value line and a few missing it
In repeated sampling, most 95 percent intervals catch the true value.
A confidence interval is often misunderstood. A 95 percent confidence interval does not mean there is a 95 percent chance that one finished interval contains the true value. After the sample is taken, the interval is fixed. The true population value is also fixed. The 95 percent refers to the long-run success of the method. If we repeated the same random sampling process many times, about 95 percent of the intervals made this way would capture the true value. This is an intuition-level idea, but it is powerful. It connects one poll to a pattern across many possible polls. It also explains why different polls can give slightly different results on the same day. Random samples differ. Good statistical methods tell us how much difference to expect.

Confidence describes a process that works well over many repeats.

Vocabulary

Population
The full group that a survey is trying to describe, such as all likely voters in an election.
Sample
The smaller group of people actually surveyed.
Random sample
A sample chosen by chance so each person has a known chance of being selected.
Margin of error
A number that estimates how far a sample result may be from the true population value because of random sampling.
Confidence interval
A range built from sample data using a method that captures the true value a stated percent of the time in repeated sampling.
Bias
A systematic error that pushes survey results away from the truth, often because some groups are overrepresented or missing.

In the Classroom

Sample a jar

25 minutes | Grades 9-12

Fill a jar or bag with two colors of beads or cubes in a hidden ratio. Students take random samples of 20, 50, and 100, then compare their estimates with the true ratio after the reveal.

Build a margin of error table

20 minutes | Grades 9-12

Students compute $\frac{1}{\sqrt{n}}$ for sample sizes of 100, 400, 1000, and 1600. They graph the results and explain why quadrupling the sample size halves the margin of error.

Poll headline check

30 minutes | Grades 9-12

Give students several fictional poll results with sample sizes and margins of error. Students decide which races are clearly separated and which are too close to call from the poll alone.

Key Takeaways

  • A survey can estimate an election when the sample is chosen randomly from the population of interest.
  • Random sampling helps a small group reflect a much larger group.
  • The margin of error shrinks as sample size grows, but it shrinks by a square root pattern.
  • For a sample of about 1000, a 95 percent margin of error is often near 3 percentage points.
  • Confidence intervals describe how a sampling method performs over many repeated samples.