Practice calculating velocity and acceleration and interpreting position-time and velocity-time graphs in one dimension.
Read each problem carefully. Show your work, include units, and explain your reasoning when needed.
Interpreting motion with equations, graphs, and units
Physics - Grade 9-12
- 1
A car travels 120 meters east in 10 seconds. What is its average velocity?
- 2
A cyclist speeds up from 4 meters per second to 10 meters per second in 3 seconds. What is the cyclist's average acceleration?
- 3
A runner moves with a constant velocity of 6 meters per second for 8 seconds. How far does the runner travel?
- 4
An object has an initial velocity of 5 meters per second and accelerates at 2 meters per second squared for 4 seconds. What is its final velocity?
- 5
A ball rolling along the floor slows from 9 meters per second to 3 meters per second in 2 seconds. What is its average acceleration?
- 6
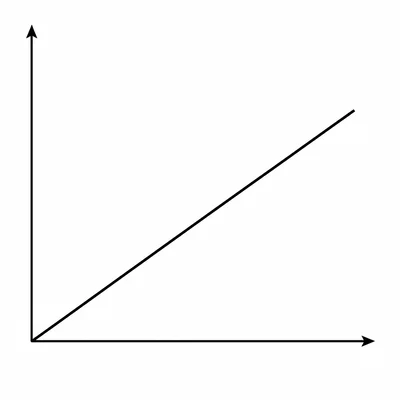
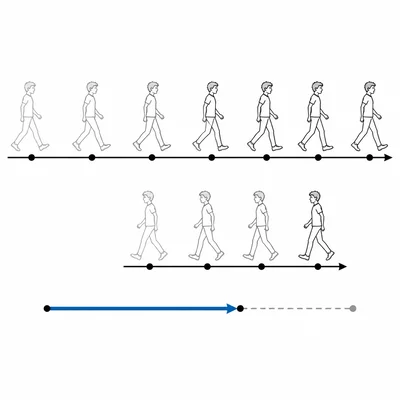
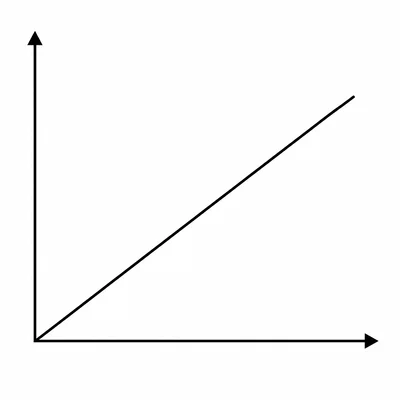
On a position-time graph, a line rises steadily from left to right with a constant slope. What does this tell you about the object's motion?
- 7
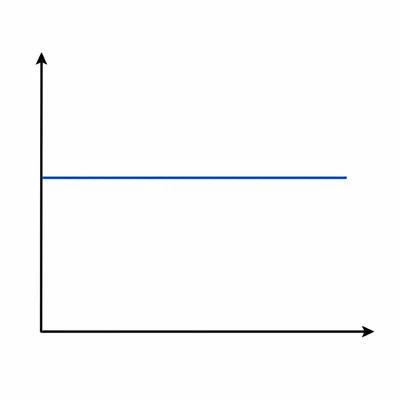
On a position-time graph, a horizontal line is shown from 2 seconds to 6 seconds. What does this mean about the object's motion during that time interval?
- 8
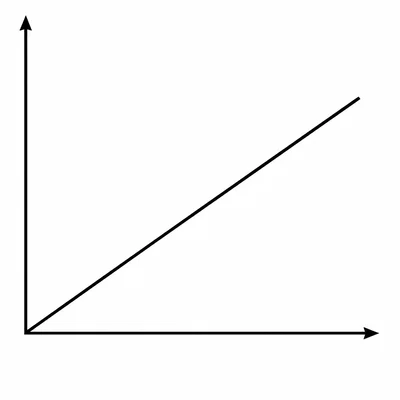
On a velocity-time graph, the velocity increases from 2 meters per second at 0 seconds to 8 meters per second at 3 seconds. What is the acceleration?
- 9
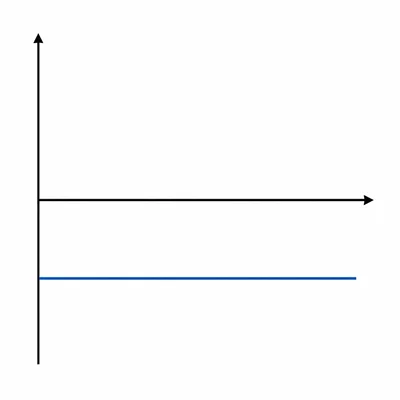
On a velocity-time graph, a line stays at -4 meters per second for 5 seconds. What does this tell you about the object's motion?
- 10
A train moving at 20 meters per second comes to rest in 5 seconds. What is its average acceleration?
- 11
A student walks 30 meters east in 10 seconds, then 10 meters west in 5 seconds. What is the student's average velocity for the whole trip?
- 12
An object starts from rest and accelerates at 3 meters per second squared for 6 seconds. What is its final velocity, and what is the shape of its velocity-time graph during this interval?