Simpson's Paradox Explorer
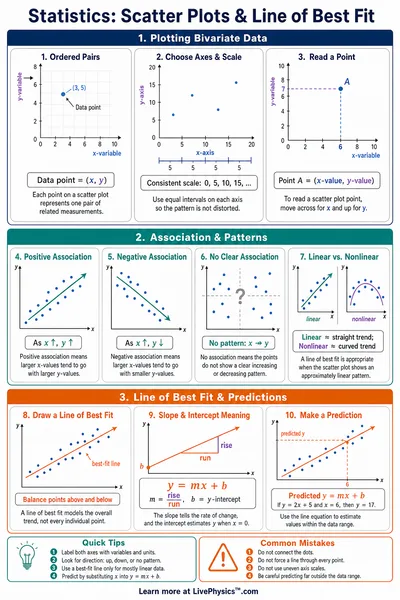
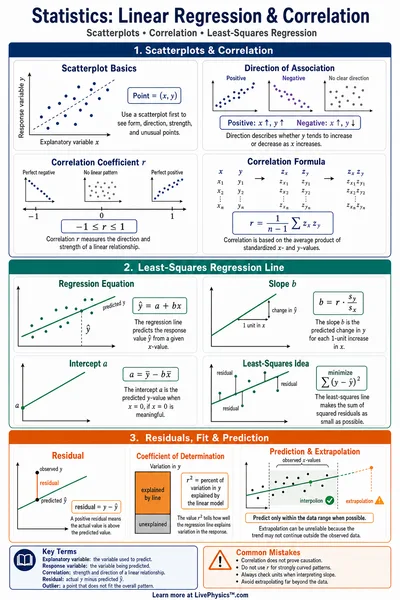
Build several groups of points where every group trends in one direction. When the points are pooled, the overall regression slope can flip to the opposite sign because the group centroids line up the other way. Adjust the within-group slope, the between-group slope, separation, and noise, then toggle split versus combined to watch the trend reverse.
Controls
View
Presets
Trends
Simpson's paradox
Each group trends up, but combined the trend goes down.
Within-group slopes
Mean within slope
+0.98
Pooled slope
-1.70
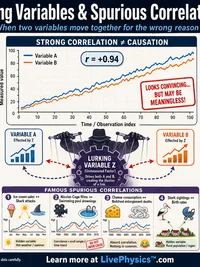
The arrangement of the groups acts as a lurking variable. Pooling the data lets the between-group spacing dominate, which can reverse the direction seen inside every single group.
Each group on its own
Colored lines show each group's own trend. Toggle to Combined to pool the points.
Reference Guide
What is Simpson's paradox
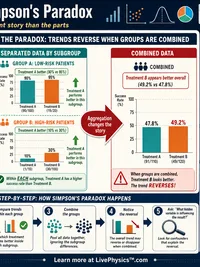
Simpson's paradox is a reversal of a statistical trend when data are split into groups versus pooled together. A relationship that holds inside every subgroup can vanish or even point the other way once the subgroups are combined.
In this tool the effect appears as a regression slope. Each colored group can trend upward while the single line through all the points trends downward.
The lurking variable
The reversal is driven by a confounding or lurking variable, which here is group membership. The groups sit at different positions in the plane, so the spacing between groups carries its own trend.
When the groups are pooled, that between-group spacing dominates the fit. The pooled slope follows the centroids rather than the within-group structure, so it can oppose every individual group.
Real examples
- UC Berkeley admissions. Overall data suggested a bias against women, yet most individual departments admitted women at equal or higher rates. Women applied more to competitive departments with low acceptance for everyone.
- Kidney stone treatments. Treatment A beat treatment B for both small stones and large stones, but B looked better overall because the harder cases were sent to A.
- Baseball batting averages. One player can have a higher average than another in each of two seasons, yet a lower combined average across both seasons.
The lesson about pooling
Aggregating data is not always neutral. Before pooling, ask whether a grouping variable is correlated with both the inputs and the outcome, because that is exactly the setup that produces a reversal.
The fix is to condition on the lurking variable. Compare within comparable groups, or model the group effect directly, instead of trusting a single number from the pooled set.