Practice interpreting enzyme lab data, calculating reaction rates, and explaining how pH and temperature affect enzyme activity.
Read each problem carefully. Use the data given to calculate rates, compare conditions, and explain enzyme behavior. Show your work in the space provided.
Analyze enzyme reaction rates using lab data
Biology - Grade 9-12
- 1
In a catalase lab, students measured oxygen production from hydrogen peroxide. The reaction produced 12 mL of oxygen in 3 minutes. Calculate the average reaction rate in mL per minute.
- 2
A reaction produced 0 mL of oxygen at 0 minutes, 5 mL at 1 minute, 9 mL at 2 minutes, and 12 mL at 3 minutes. During which one-minute interval was the reaction fastest?
- 3
A student tested an enzyme at different pH values. The rates were: pH 3 = 1 unit/min, pH 5 = 4 units/min, pH 7 = 9 units/min, pH 9 = 5 units/min, and pH 11 = 1 unit/min. Identify the enzyme's optimum pH.
- 4
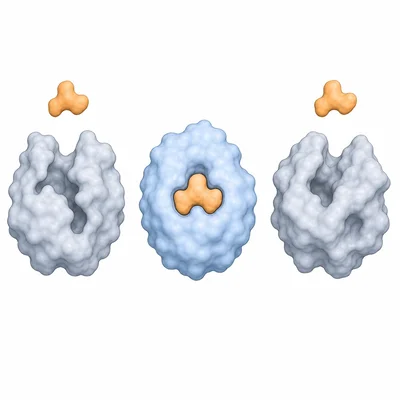
Using the pH data from the previous problem, explain why the enzyme activity decreased at pH 3 and pH 11.
- 5
A student tested enzyme activity at different temperatures. The rates were: 10°C = 2 units/min, 20°C = 5 units/min, 30°C = 9 units/min, 40°C = 12 units/min, 50°C = 4 units/min, and 60°C = 0 units/min. What temperature produced the highest enzyme activity?
- 6
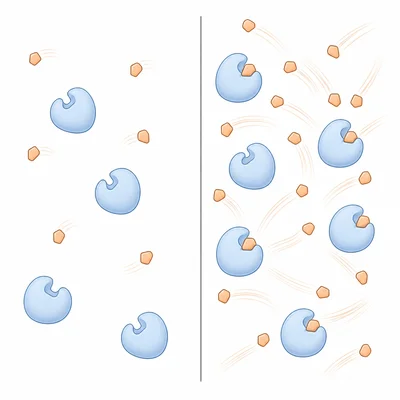
Using the temperature data from the previous problem, explain why the rate increased from 10°C to 40°C.
- 7
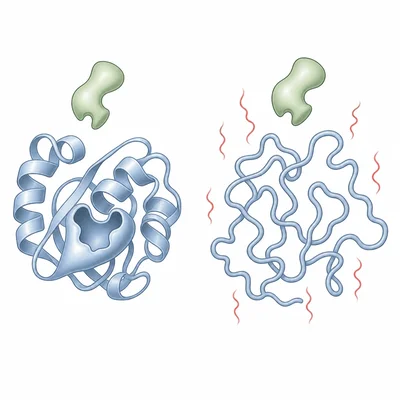
Using the temperature data from problem 5, explain why the rate dropped sharply at 50°C and reached 0 units/min at 60°C.
- 8
Two groups measured catalase activity at pH 7. Group A produced 18 mL oxygen in 3 minutes. Group B produced 24 mL oxygen in 4 minutes. Which group had the higher average reaction rate?
- 9
A lab report says, "The enzyme worked better at pH 8 than at pH 6." What specific type of data would best support this claim?
- 10
A student measured starch digestion by amylase using iodine color. The solution turned from dark blue-black to light brown in 2 minutes at pH 7 and in 8 minutes at pH 4. Which pH had the faster enzyme activity, and how do you know?
- 11
A student collected the following data for product formation: 0 seconds = 0 mg, 20 seconds = 6 mg, 40 seconds = 11 mg, 60 seconds = 15 mg. Calculate the average reaction rate from 0 to 60 seconds in mg per second.
- 12
Using the data in problem 11, calculate the reaction rate from 20 seconds to 40 seconds.
- 13
A student wants to test how temperature affects an enzyme. Identify the independent variable, dependent variable, and two controlled variables for this experiment.
- 14
A data table shows that an enzyme has high activity at pH 2, low activity at pH 7, and no activity at pH 10. Based on this pattern, what type of environment might this enzyme normally work in?
- 15
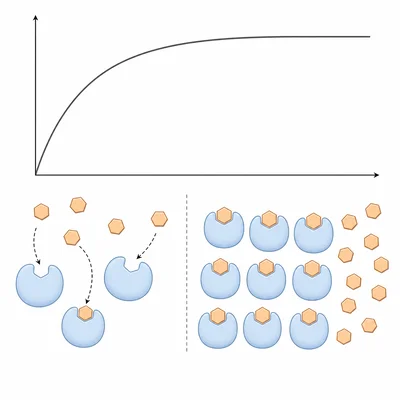
A graph of enzyme activity versus substrate concentration rises quickly at low substrate concentrations and then levels off at high substrate concentrations. Explain why the graph levels off.