Practice finding five-number summaries, interpreting box plots, and comparing data sets.
Read each problem carefully. Show your work and explain your reasoning when needed.
Reading quartiles, medians, and spread in data
Math - Grade 6-8
- 1

Find the median of this data set: 4, 7, 9, 10, 12, 15, 18.
- 2

Find the median of this data set: 6, 8, 11, 13, 17, 20.
- 3
Find the first quartile, median, and third quartile for this ordered data set: 3, 5, 8, 9, 12, 14, 16, 20, 21.
- 4
Find the five-number summary for this ordered data set: 2, 4, 6, 8, 10, 12, 14, 16, 18.
- 5
A box plot has minimum 5, first quartile 9, median 12, third quartile 18, and maximum 22. What is the interquartile range?
- 6
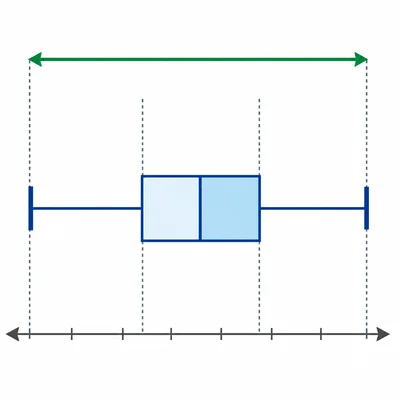
A box plot has minimum 1, first quartile 4, median 7, third quartile 11, and maximum 15. What is the range?
- 7

This box plot summary describes quiz scores: minimum 50, first quartile 60, median 72, third quartile 85, maximum 95. What percent of the scores are at or below 72?
- 8
This box plot summary describes plant heights in centimeters: minimum 12, first quartile 18, median 24, third quartile 30, maximum 36. Between which two values is the middle 50 percent of the data?
- 9
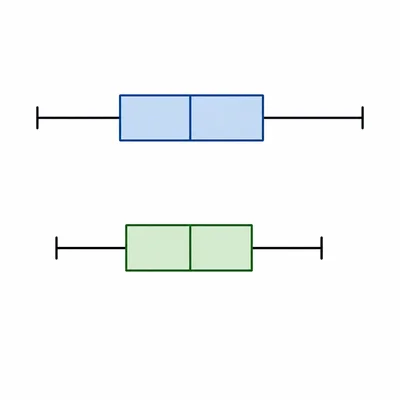
Two classes took the same test. Class A has five-number summary 55, 68, 74, 82, 96. Class B has five-number summary 50, 70, 74, 78, 90. Which class has the greater range?
- 10
Two teams recorded the number of points scored in games. Team X has five-number summary 10, 14, 20, 25, 29. Team Y has five-number summary 8, 15, 20, 23, 31. Which team has the greater interquartile range?
- 11
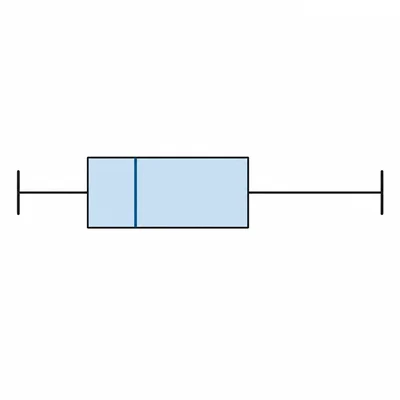
A data set has minimum 7, first quartile 10, median 13, third quartile 19, and maximum 24. Draw conclusions about whether the data are more spread out above or below the median.
- 12

The ordered data set is 5, 6, 8, 9, 10, 11, 14, 15, 18, 20. Find the first quartile, median, third quartile, and interquartile range.
- 13

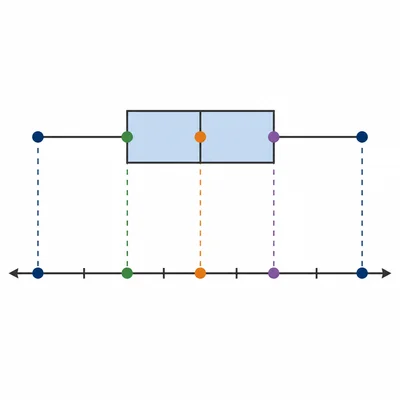
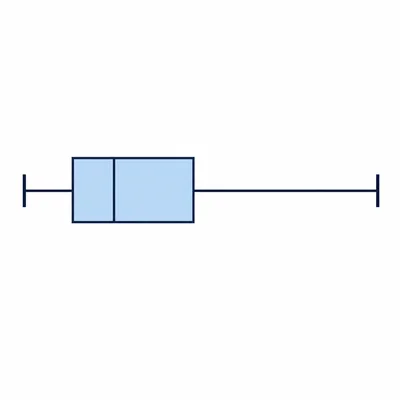
A box plot for daily temperatures shows minimum 60, first quartile 65, median 70, third quartile 80, and maximum 90. Explain what the box part of the plot represents.
- 14
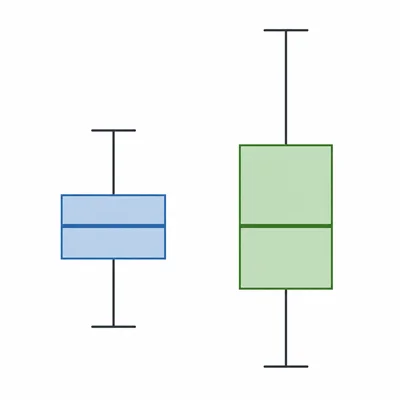
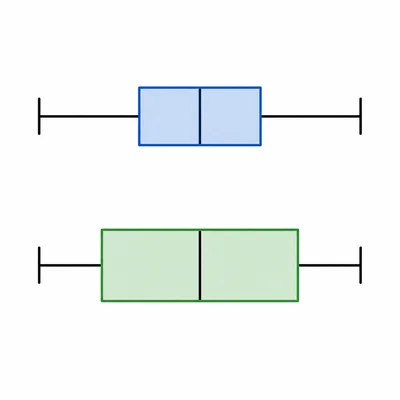
A student says, "If two box plots have the same median, then the data sets have the same spread." Is the student correct? Explain.
- 15
A set of running times has five-number summary 18, 22, 25, 31, 40. Write two true statements about this data set.