Practice making and reading line plots and dot plots using simple data sets.
Read each problem carefully. Use the data or plot to answer the question. Show your work in the space provided.
Organizing and reading data with Xs and dots
Math - Grade 2-3
- 1
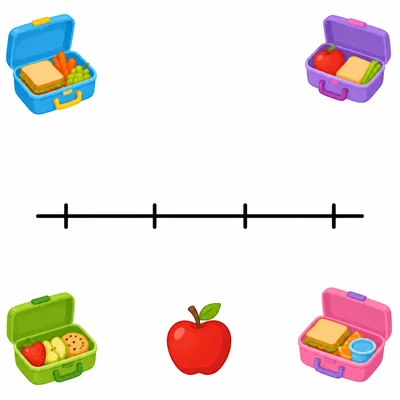
The numbers of apples in 8 lunch boxes are 2, 3, 2, 4, 1, 2, 3, and 4. Make a dot plot for the data.
- 2
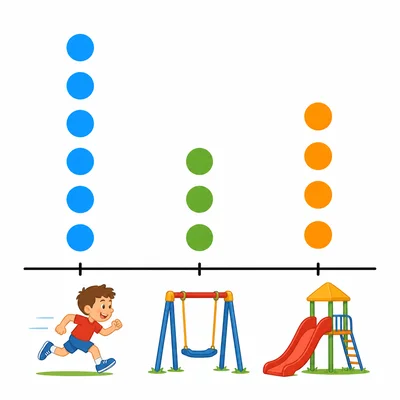
A dot plot shows favorite playground games. Tag has 5 dots, swings has 3 dots, and slide has 4 dots. Which game was chosen by the most students?
- 3
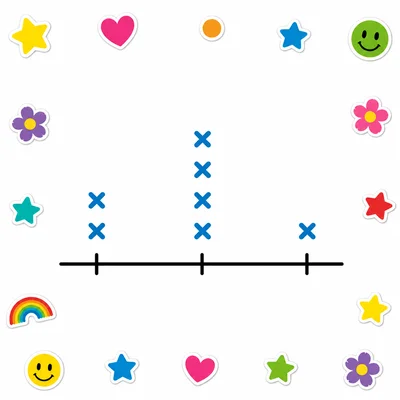
A line plot shows the number of stickers students have. There are 2 Xs above 4, 4 Xs above 5, and 1 X above 6. How many students are shown in all?
- 4
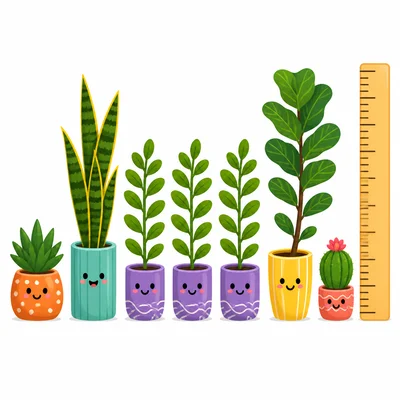
The heights of 9 plants in inches are 5, 6, 5, 7, 6, 6, 8, 5, and 7. How many plants are 6 inches tall?
- 5
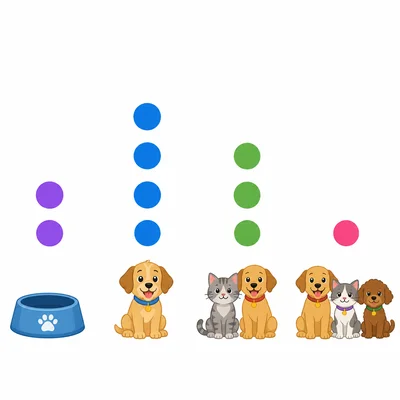
Use this dot plot data: 0 pets has 2 dots, 1 pet has 4 dots, 2 pets has 3 dots, and 3 pets has 1 dot. How many students have at least 2 pets?
- 6
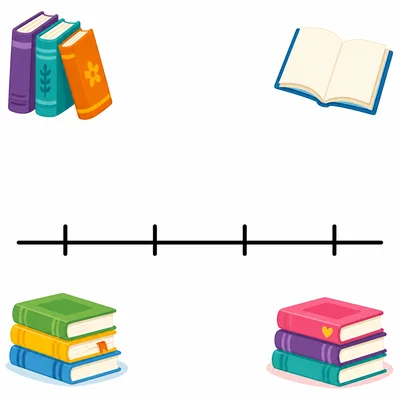
The number of books read by students are 1, 2, 2, 3, 3, 3, 4, and 4. Which number should have the most dots on a dot plot?
- 7
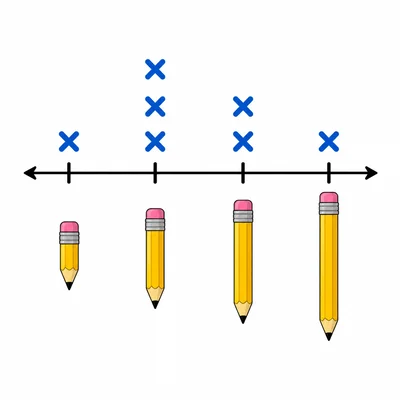
A line plot shows pencil lengths in inches. There is 1 X above 5, 3 Xs above 6, 2 Xs above 7, and 1 X above 8. How many more pencils are 6 inches long than 8 inches long?
- 8
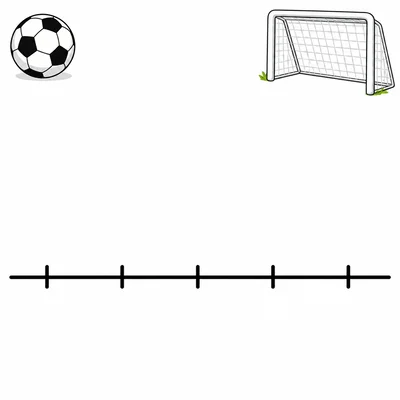
The numbers of goals scored in soccer games are 2, 1, 3, 2, 0, 2, 1, and 4. Make a line plot for the data.
- 9
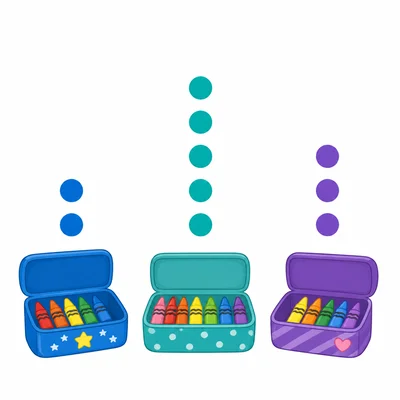
A dot plot shows how many crayons are in pencil boxes. 6 crayons has 2 dots, 7 crayons has 5 dots, and 8 crayons has 3 dots. How many pencil boxes have 7 crayons?
- 10
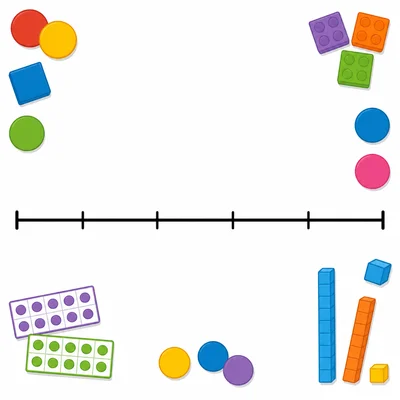
The data are 10, 12, 11, 10, 13, 12, 10, and 11. What numbers should be labeled on the number line for a line plot?
- 11
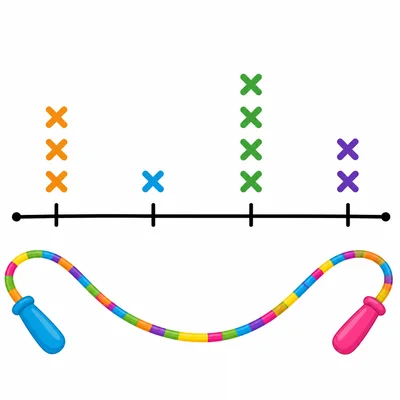
A line plot shows jump rope counts. 20 has 3 Xs, 21 has 1 X, 22 has 4 Xs, and 23 has 2 Xs. Which count happened exactly 2 times?
- 12

Mia made a dot plot for this data: 1, 1, 2, 2, 2, 3, and 4. She put 2 dots above 1, 2 dots above 2, 1 dot above 3, and 1 dot above 4. What mistake did Mia make?
- 13

A dot plot shows the number of sunny days each week. 4 days has 1 dot, 5 days has 3 dots, 6 days has 2 dots, and 7 days has 4 dots. How many weeks are shown?
- 14
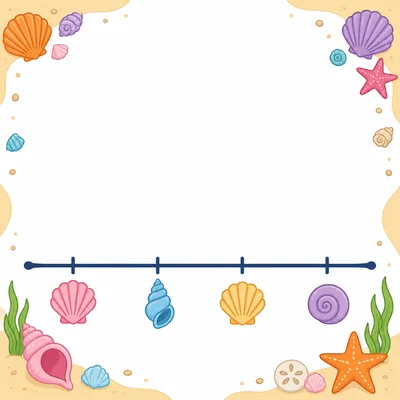
The numbers of shells collected by 10 students are 5, 6, 5, 8, 7, 6, 5, 8, 6, and 7. Which two numbers have the same number of dots on a dot plot?
- 15

A line plot shows points scored in a game. 2 points has 2 Xs, 3 points has 3 Xs, 4 points has 2 Xs, and 5 points has 1 X. What is the difference between the greatest number of points and the least number of points shown?