Practice finding the mean, median, and mode using data shown in simple tables.
Read each table carefully. Use the numbers in the table to find the mean, median, or mode. Show your work in the space provided.
Finding averages and common values in data tables
Math - Grade 4-5
- 1
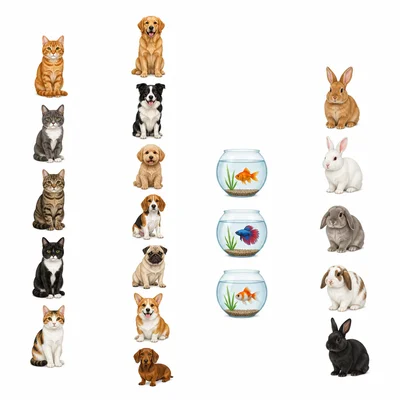
A class counted the number of pets owned by four groups. Table: Group A has 5 pets, Group B has 7 pets, Group C has 3 pets, and Group D has 5 pets. Find the mean number of pets.
- 2

Five students recorded how many books they read in a month. Table: Ana read 2, Ben read 4, Cara read 4, Diego read 6, and Eli read 9. Find the mode.
- 3

A garden club measured plant heights in centimeters. Table: Plant 1 is 12 cm, Plant 2 is 15 cm, Plant 3 is 15 cm, Plant 4 is 18 cm, and Plant 5 is 20 cm. Find the median height.
- 4
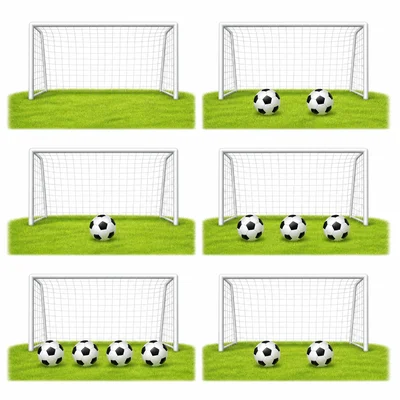
A soccer team recorded goals scored in six games. Table: Game 1 has 0 goals, Game 2 has 2 goals, Game 3 has 1 goal, Game 4 has 3 goals, Game 5 has 4 goals, and Game 6 has 2 goals. Find the mean number of goals.
- 5
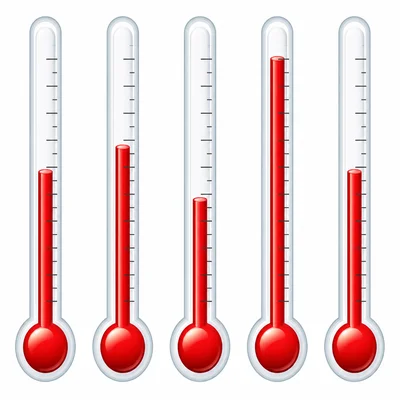
A weather table shows high temperatures for five days. Table: Monday 70 degrees, Tuesday 72 degrees, Wednesday 68 degrees, Thursday 75 degrees, and Friday 70 degrees. Find the mode temperature.
- 6
A math quiz table shows these scores: 80, 90, 85, 100, and 95. Find the mean score.
- 7
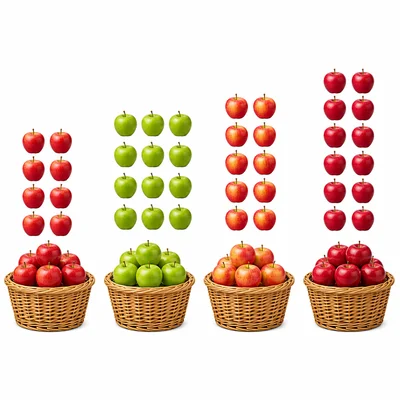
A farm stand kept a table of apples sold in four hours. Table: Hour 1 sold 8 apples, Hour 2 sold 12 apples, Hour 3 sold 10 apples, and Hour 4 sold 14 apples. Find the median number of apples sold.
- 8
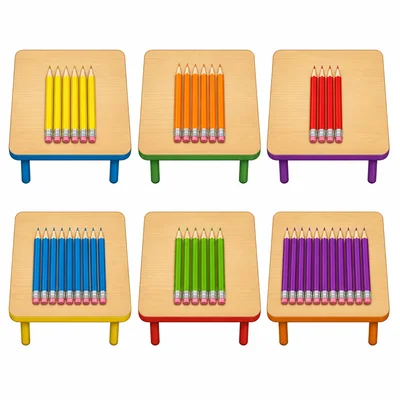
A classroom table shows the number of pencils at six tables: 6, 6, 4, 8, 6, and 10. Find the mode.
- 9

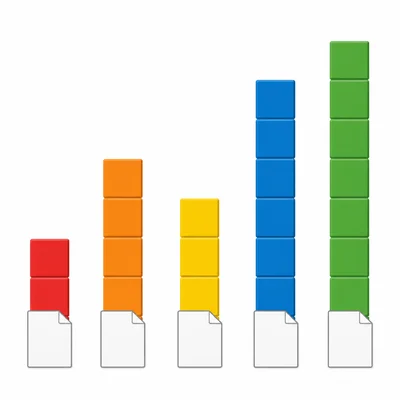
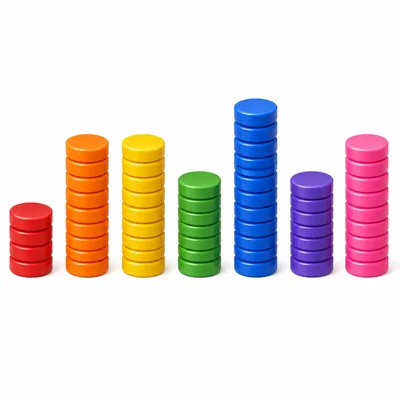
Five classes collected recycling. Table: Class A collected 15 pounds, Class B collected 20 pounds, Class C collected 25 pounds, Class D collected 30 pounds, and Class E collected 10 pounds. Find the mean pounds collected.
- 10
A player wrote down game scores in a table: 3, 7, 7, 5, 9, 5, and 7. Find the mode score.
- 11
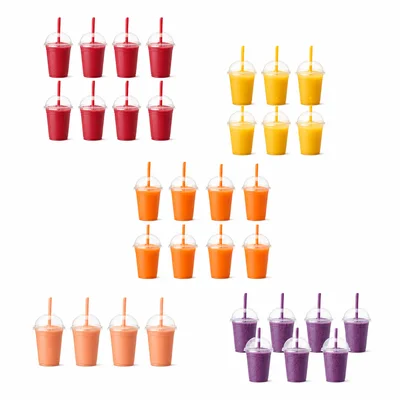
A smoothie stand recorded cups sold by flavor. Table: Strawberry 9, Banana 6, Mango 9, Peach 4, and Berry 7. Find the median number of cups sold.
- 12

A sticker table shows how many students had each number of stickers. Table: 1 sticker was held by 2 students, 2 stickers by 3 students, 3 stickers by 4 students, and 4 stickers by 1 student. Find the mode number of stickers.
- 13
A frequency table shows quiz point totals. Table: 1 point was earned by 2 students, 2 points by 3 students, 3 points by 4 students, and 4 points by 1 student. Find the mean point total.
- 14
A test score table shows this frequency information: score 80 happened 2 times, score 90 happened 3 times, and score 100 happened 1 time. Find the median score.
- 15
The cafeteria recorded milk cartons sold each day. Table: Monday 20, Tuesday 25, Wednesday 25, Thursday 30, and Friday 35. Find the mean, median, and mode.