Practice reading bar graphs by finding totals, comparing categories, and using graph data to answer questions.
Look carefully at each bar graph or data set. Read the labels and numbers before answering. Show your work in the space provided.
Use bar graphs to compare, count, and answer questions
Math - Grade 2-3
- 1
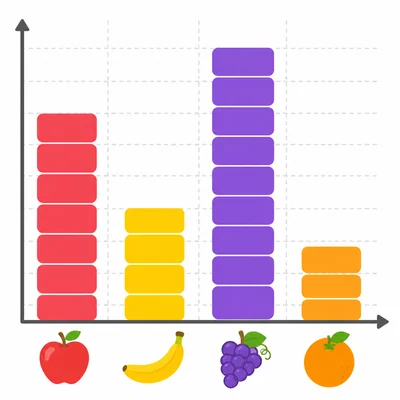
The bar graph shows favorite fruits in a class. Apples: 6 students, Bananas: 4 students, Grapes: 8 students, Oranges: 3 students. Which fruit did the most students choose?
- 2
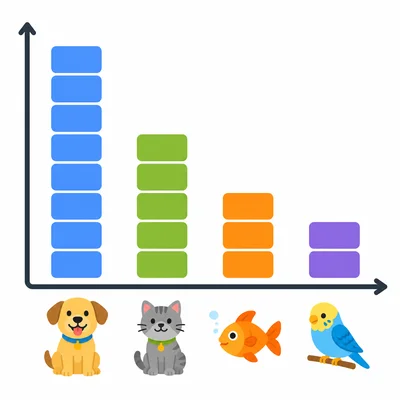
Use the pet bar graph. Dogs: 7, Cats: 5, Fish: 3, Birds: 2. How many students chose cats?
- 3
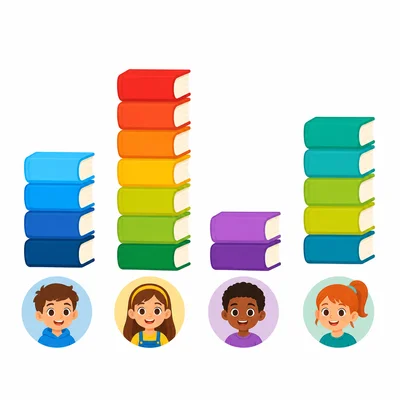
The bar graph shows books read in one week. Mia read 4 books, Leo read 6 books, Ana read 2 books, and Jay read 5 books. How many more books did Leo read than Ana?
- 4
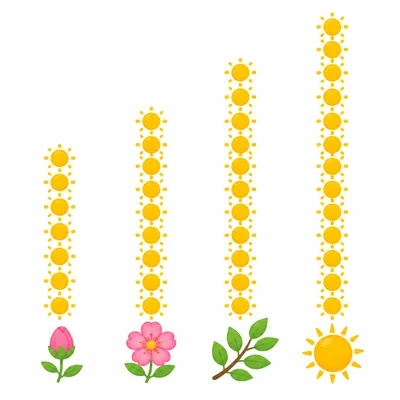
A bar graph shows the number of sunny days in four months. March had 10 sunny days, April had 12, May had 15, and June had 18. Which month had the fewest sunny days?
- 5
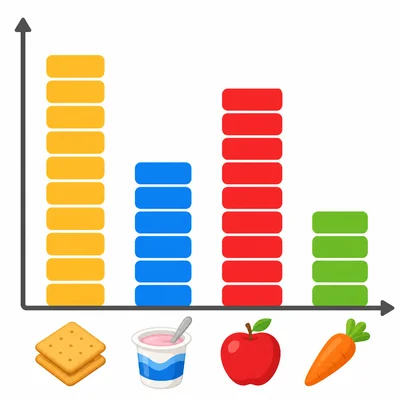
Use the snack choices data: Crackers: 9 students, Yogurt: 6 students, Apples: 8 students, Carrots: 4 students. How many students chose crackers and apples altogether?
- 6
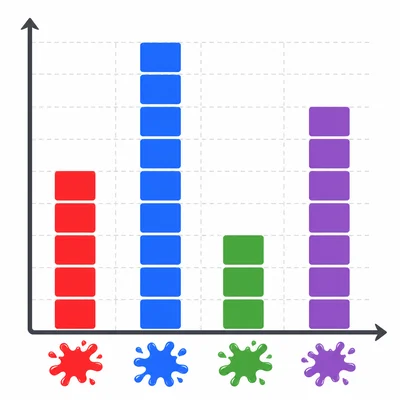
The bar graph shows favorite colors. Red: 5 students, Blue: 9 students, Green: 4 students, Purple: 7 students. Which color was chosen by exactly 7 students?
- 7
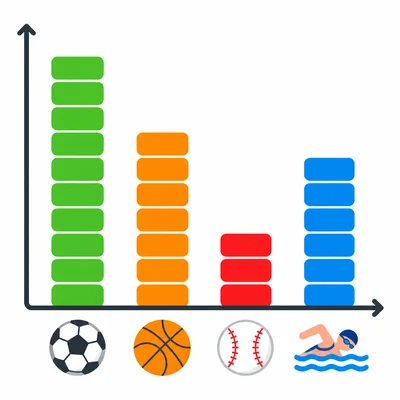
Use the sports bar graph. Soccer: 8 students, Basketball: 6 students, Baseball: 3 students, Swimming: 5 students. How many students chose soccer or basketball in all?
- 8
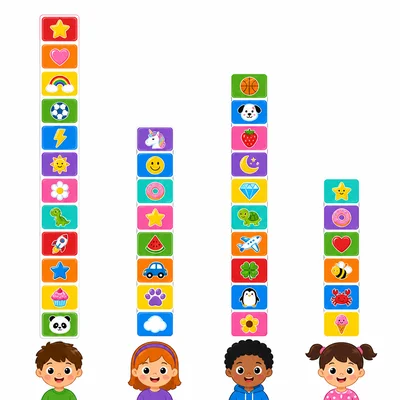
The bar graph shows stickers collected. Ava has 12 stickers, Ben has 8, Cara has 10, and Darius has 6. Who has 2 more stickers than Ben?
- 9
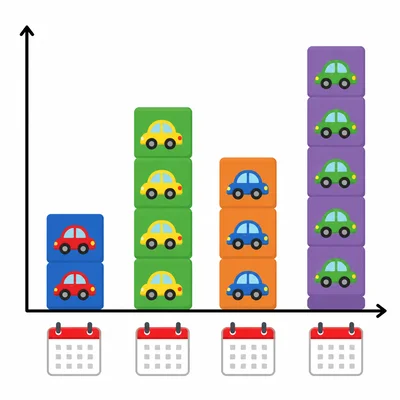
A bar graph uses a scale that counts by 2s. The bars show toy cars sold: Monday 4, Tuesday 8, Wednesday 6, Thursday 10. On which day were 10 toy cars sold?
- 10
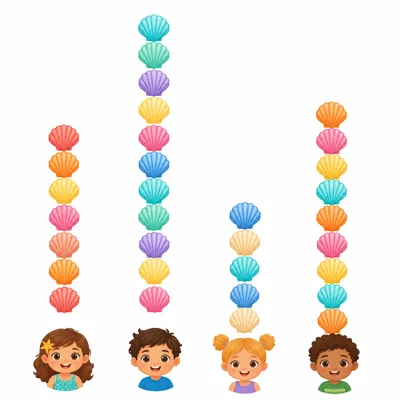
Use the data set. Number of shells found: Sam 7, Nina 11, Omar 5, Lily 9. Who found the greatest number of shells?
- 11
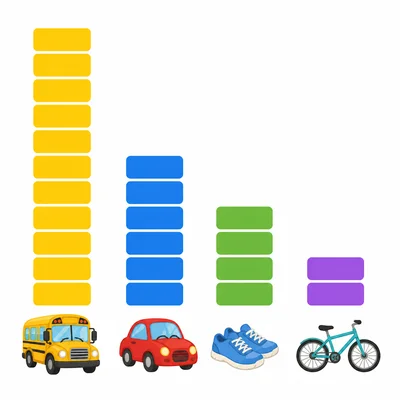
The class made a bar graph about transportation to school. Bus: 10 students, Car: 6 students, Walk: 4 students, Bike: 2 students. How many more students ride the bus than walk?
- 12
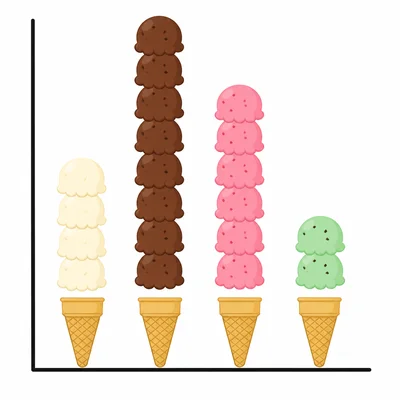
The bar graph shows favorite ice cream flavors. Vanilla: 4, Chocolate: 8, Strawberry: 6, Mint: 3. Write one true comparison sentence using the graph.
- 13
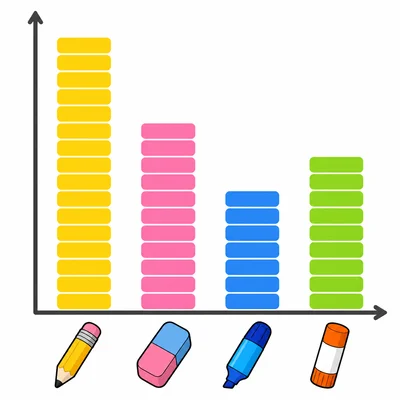
Use the school supplies data: Pencils: 14, Erasers: 10, Markers: 6, Glue sticks: 8. Which two supplies have a total of 16?
- 14
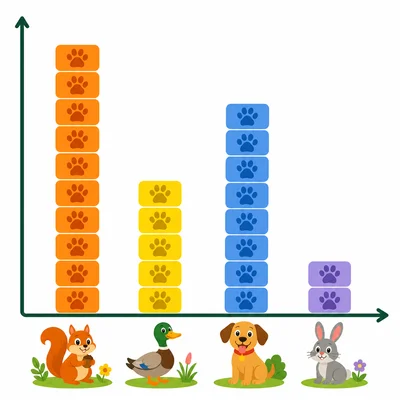
A bar graph shows animals seen at a park. Squirrels: 9, Ducks: 5, Dogs: 7, Rabbits: 2. How many animals were seen altogether?
- 15
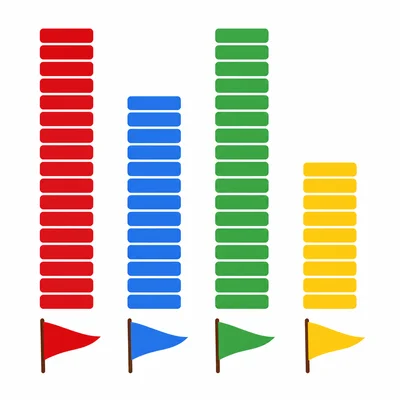
The bar graph shows points scored in a game. Team A scored 15 points, Team B scored 12 points, Team C scored 15 points, and Team D scored 9 points. Which two teams scored the same number of points?