Practice reading pie charts and circle graphs to compare categories, find totals, and understand parts of a whole.
Read each problem carefully. Use the information in the circle graph or chart description to answer. Show your work in the space provided.
Interpreting parts of a whole using fractions and percents
Math - Grade 4-5
- 1
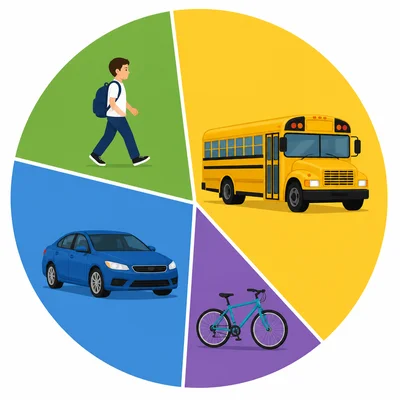
A circle graph shows how 100 students get to school: Bus 40%, Car 30%, Walk 20%, Bike 10%. Which way do the most students get to school?
- 2
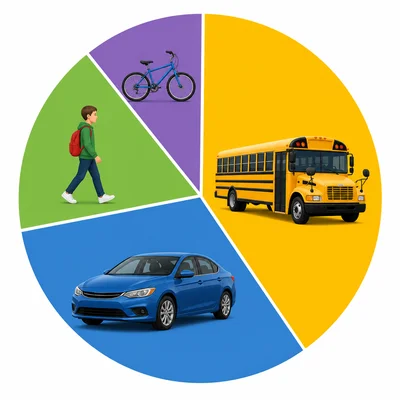
Using the same school transportation graph, how many students walk to school if the graph represents 100 students?
- 3
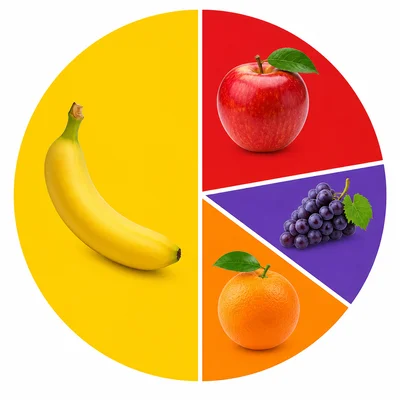
A circle graph shows favorite fruits in a class: Apples 1/4, Bananas 1/2, Grapes 1/8, Oranges 1/8. Which fruit was chosen by half of the class?
- 4
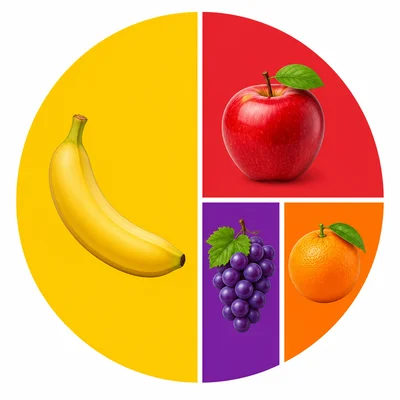
In the favorite fruits graph, which two fruits were chosen by the same fraction of the class?
- 5

A circle graph shows how Mia spends 4 hours after school: Homework 25%, Reading 25%, Sports 25%, Chores 25%. How much time does Mia spend on homework?
- 6
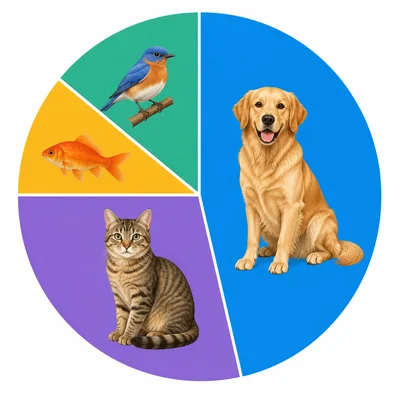
A pet survey circle graph shows: Dogs 45%, Cats 35%, Fish 10%, Birds 10%. Which two pet choices have equal parts of the graph?
- 7
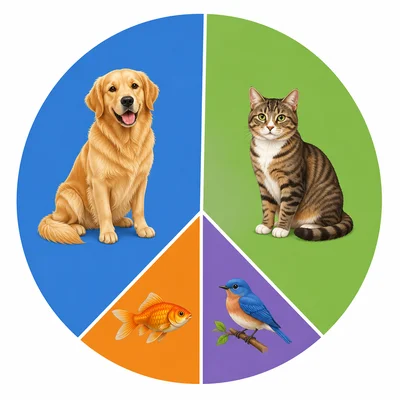
In the pet survey graph, what percent of students chose dogs or cats altogether?
- 8
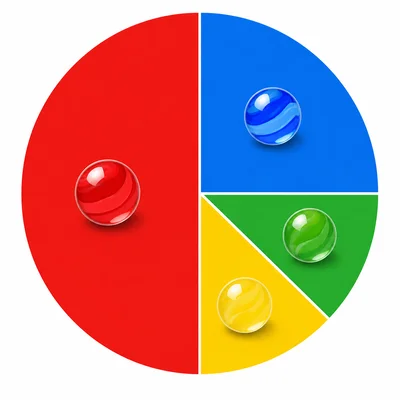
A circle graph shows the colors of 200 marbles in a bag: Red 50%, Blue 25%, Green 15%, Yellow 10%. How many marbles are blue?
- 9
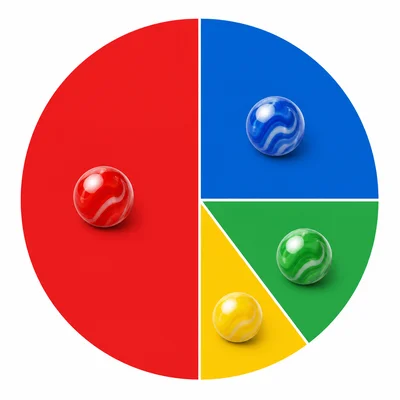
Using the marble colors graph, which color has the smallest number of marbles?
- 10
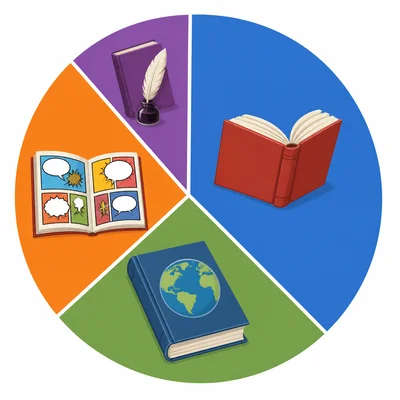
A circle graph shows library book types checked out in one day: Fiction 40%, Nonfiction 30%, Comics 20%, Poetry 10%. If 50 books were checked out, how many were comics?
- 11
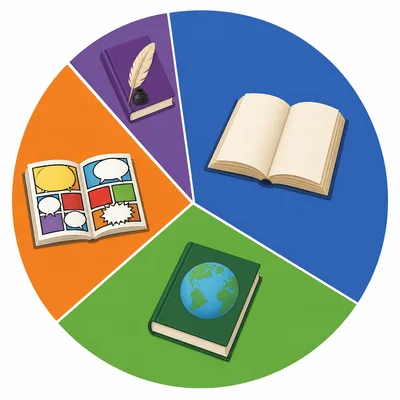
In the library book graph, which type of book was checked out twice as often as poetry?
- 12
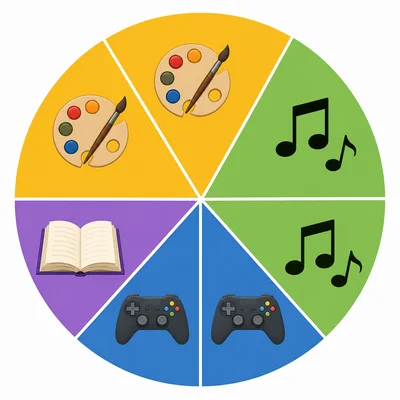
A class activity circle graph shows: Art 3/8, Music 2/8, Games 2/8, Reading 1/8. Which activity has the largest section?
- 13
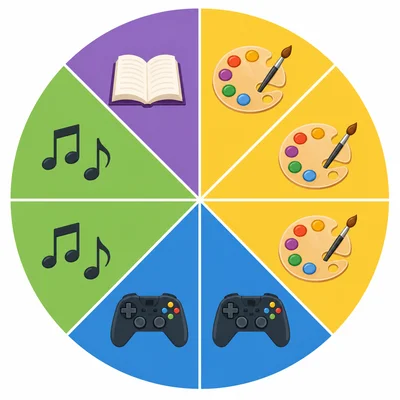
Using the class activity graph, what fraction of the class chose music or games altogether?
- 14
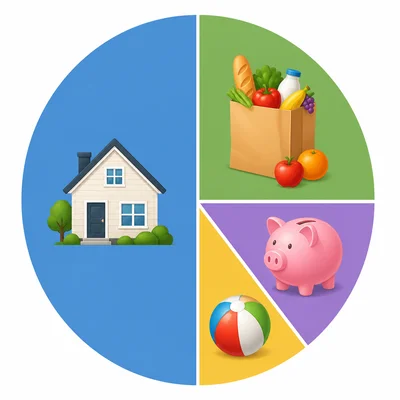
A circle graph shows a family's monthly spending: Rent 50%, Food 25%, Savings 15%, Fun 10%. If the family spends $2,000 in all, how much is spent on food?
- 15
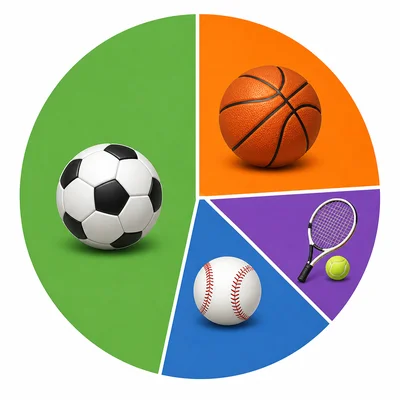
A sports club circle graph shows favorite sports: Soccer 30%, Basketball 30%, Baseball 25%, Tennis 15%. What is the difference between the percent who chose baseball and the percent who chose tennis?