Practice reading shot charts, calculating shooting percentages, and using sports statistics to choose effective game strategies.
Read each problem carefully. Use the shot chart or data when given. Show your work and explain your strategy in the space provided.
Using shot data to make smarter game decisions
Physical Education - Grade 6-8
- 1
A basketball player takes 12 shots from the left side of the court and makes 6 of them. What is the player's shooting percentage from the left side?
- 2
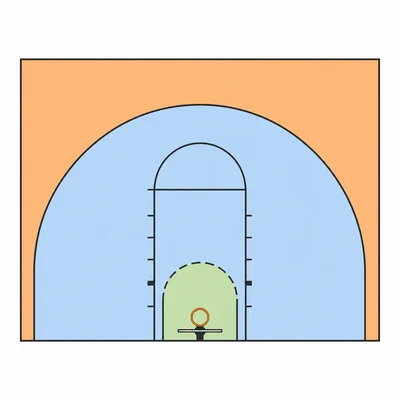
A shot chart shows that a team made 8 of 10 layups, 4 of 12 mid-range shots, and 3 of 10 three-point shots. Which shot type had the highest shooting percentage?
- 3
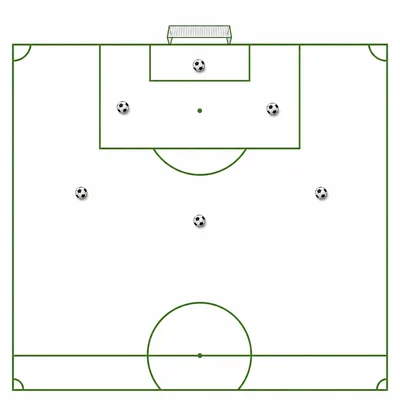
During a soccer match, a player takes 5 shots from inside the penalty box and scores 2 goals. The same player takes 6 shots from outside the penalty box and scores 0 goals. What strategy should the player consider for the next game?
- 4
A volleyball team records attack attempts. Player A has 10 kills on 20 attempts. Player B has 8 kills on 12 attempts. Which player has the better kill percentage?
- 5
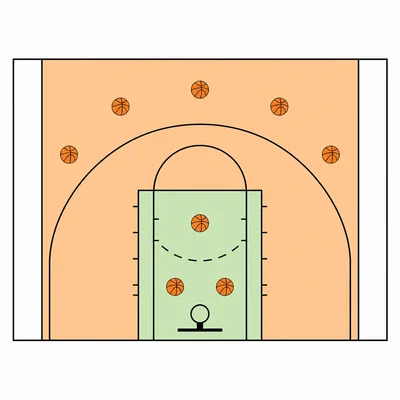
A basketball team makes 9 of 15 shots in the paint and 5 of 20 shots outside the paint. Explain one offensive strategy the team should use based on this data.
- 6
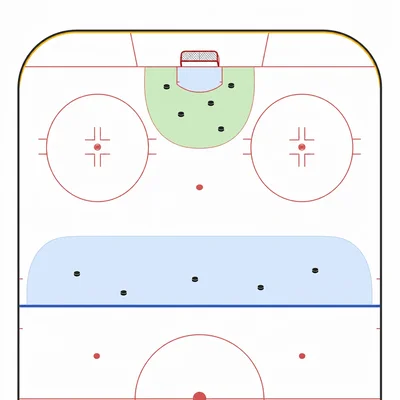
A hockey team takes 18 shots from close range and scores 3 goals. It takes 12 shots from the blue line and scores 1 goal. Calculate the scoring percentage for each area.
- 7
A basketball player attempted 24 shots in a game and made 9. In the next game, the player attempted 16 shots and made 8. In which game was the player more efficient?
- 8
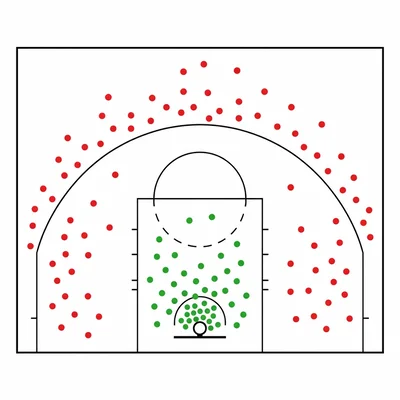
A shot chart uses green dots for made shots and red dots for missed shots. Most green dots are near the basket, while most red dots are far from the basket. What does this pattern suggest?
- 9
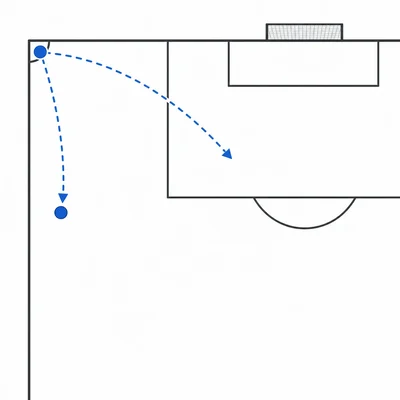
A soccer coach tracks corner kicks. The team takes 10 short corner kicks and creates 4 shots. It takes 8 long corner kicks and creates 2 shots. Which corner kick strategy created shots at a higher rate?
- 10
In basketball, a two-point shot is worth 2 points and a three-point shot is worth 3 points. A team makes 6 of 10 two-point shots and 3 of 10 three-point shots. Which group of 10 shots produced more points?
- 11
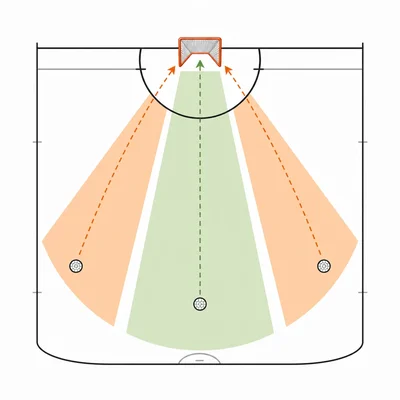
A lacrosse player scores on 4 of 8 shots from the center and 1 of 7 shots from the side. How can this data help the team's offense?
- 12
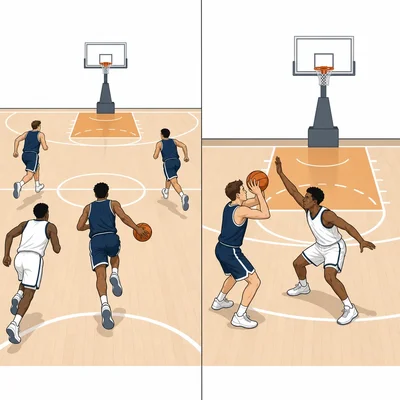
A basketball team wants to improve its shot selection. The team made 14 of 20 fast-break shots but only 6 of 24 contested half-court shots. What practice focus could help the team use this information?
- 13
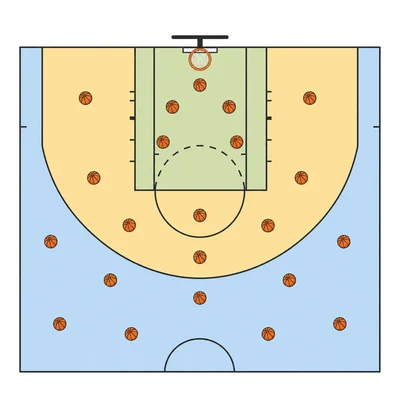
A team chart shows 30 total shots: 12 from Zone A, 10 from Zone B, and 8 from Zone C. The team made 6 shots from Zone A, 2 from Zone B, and 4 from Zone C. Which zone had the highest success rate?
- 14
A basketball coach says, "We should always take three-point shots because they are worth more points." Use statistics to explain why this may not always be the best strategy.
- 15
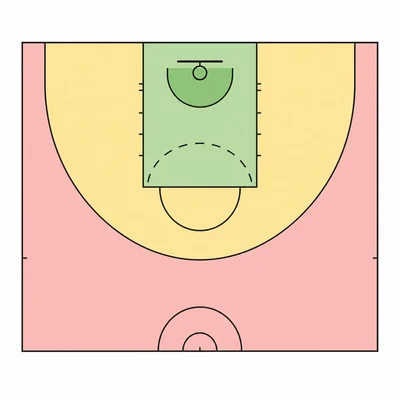
Create a simple game strategy from this data: your team makes 70% of close shots, 40% of mid-range shots, and 25% of long shots. Write two choices your team should make during the next game.