Practice interpreting population growth patterns, limiting factors, carrying capacity, and ecological models.
Read each problem carefully. Show your work and explain your reasoning when needed.
Exploring how populations change over time
Biology - Grade 9-12
- 1
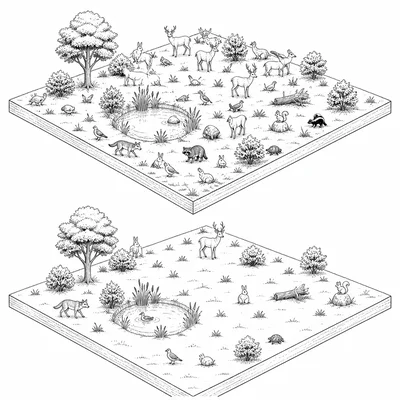
Define population size and population density. Then explain how they are different.
- 2
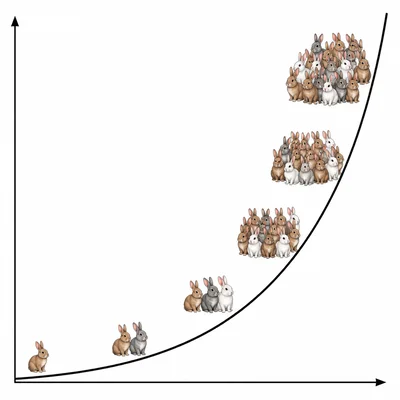
A rabbit population has abundant food and no major predators. It starts with 40 rabbits and grows rapidly each month. Identify the type of growth model that best fits this situation and explain why.
- 3
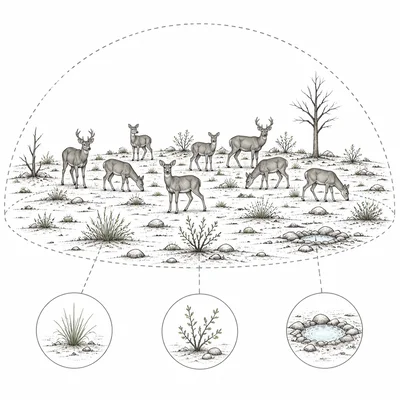
Describe carrying capacity in an ecosystem. Give one example of a factor that can affect it.
- 4
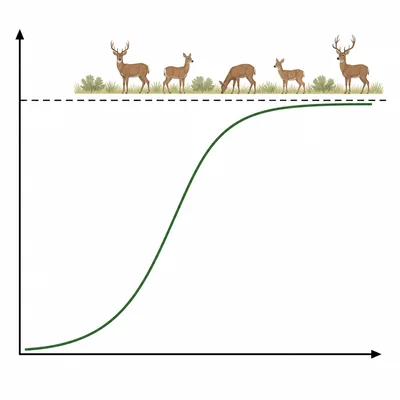
A deer population grows quickly for several years, then slows and levels off near 500 deer. What type of growth curve does this describe, and what does the leveling off mean?
- 5
List two density-dependent limiting factors and explain how each can slow population growth.
- 6
List two density-independent limiting factors and explain how each can affect a population.
- 7
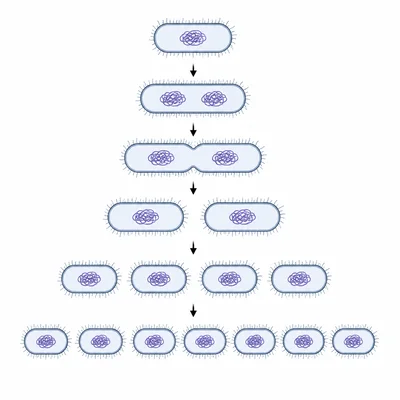
A bacterial culture doubles every hour. If it begins with 200 cells, how many cells will there be after 3 hours? State the pattern you used.
- 8
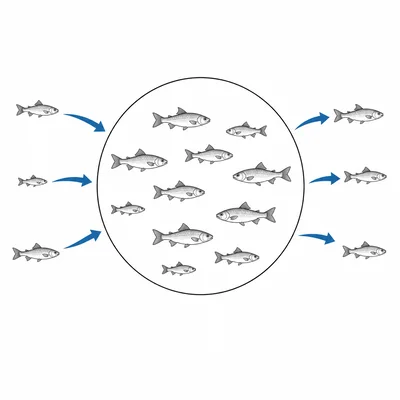
In a fish population, natality is 120 fish per year, mortality is 80 fish per year, immigration is 25 fish per year, and emigration is 15 fish per year. Calculate the net annual population change.
- 9
Explain why populations do not usually grow exponentially for long periods in natural ecosystems.
- 10
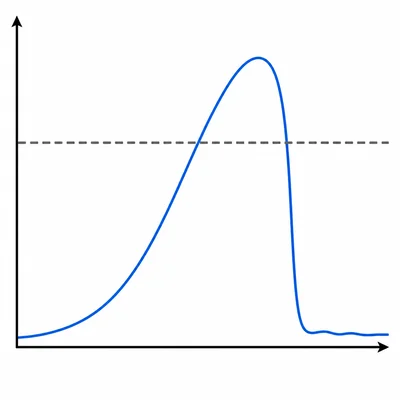
A graph shows a population crashing after overshooting its carrying capacity. Explain what overshoot means and give one possible cause of the crash.
- 11
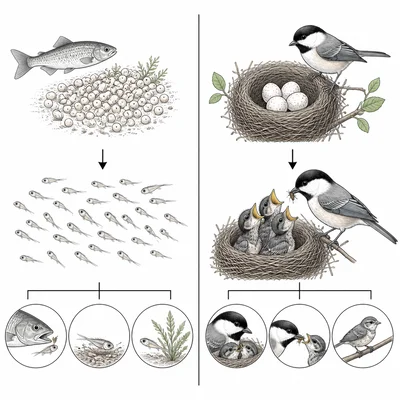
Compare r-selected species and K-selected species by describing one characteristic of each.
- 12
A scientist introduces a new predator into an area to control an herbivore population that has grown too large. Predict one likely effect on the herbivore population and one possible ecological risk.