Practice reading simple survey results, comparing choices, and finding totals.
Read each survey carefully. Use the results to answer each question. Show your work in the space provided.
Using survey results to answer questions
Statistics - Grade 2-3
- 1
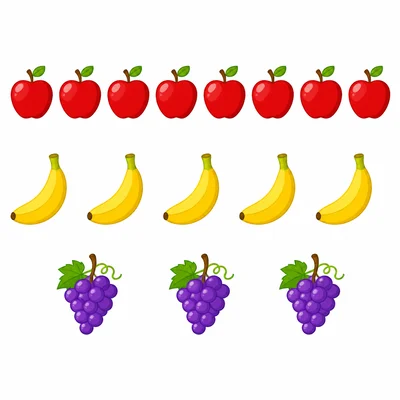
A class voted for their favorite fruit. Apples got 8 votes, bananas got 5 votes, and grapes got 3 votes. Which fruit got the most votes?
- 2
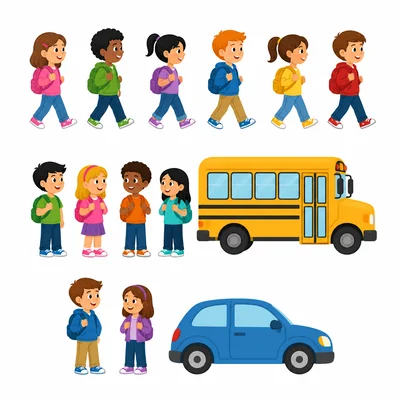
A survey asked students how they get to school. 6 students walk, 4 students ride the bus, and 2 students ride in a car. How many students were surveyed in all?
- 3

Students chose their favorite pet. Dogs got 7 votes, cats got 7 votes, and fish got 4 votes. Which two pets had the same number of votes?
- 4
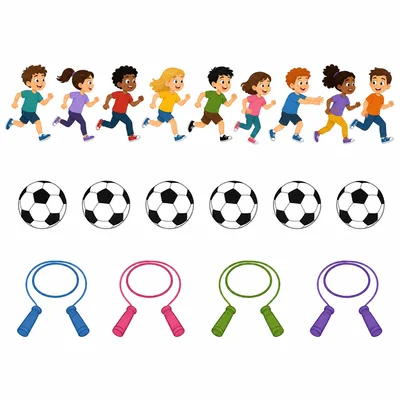
A class voted for a game to play at recess. Tag got 9 votes, soccer got 6 votes, and jump rope got 4 votes. How many more votes did tag get than jump rope?
- 5

A survey asked students to choose a favorite color. Red got 5 votes, blue got 10 votes, green got 4 votes, and yellow got 3 votes. Which color got the fewest votes?
- 6
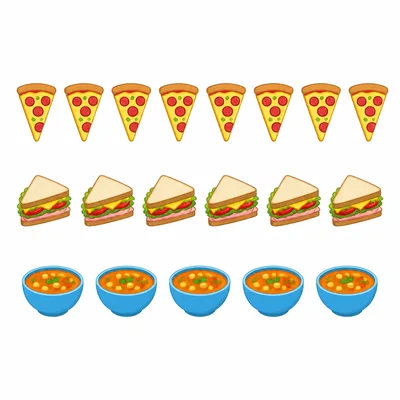
A lunch survey showed that 8 students chose pizza, 6 chose sandwiches, and 5 chose soup. How many students chose pizza or sandwiches?
- 7
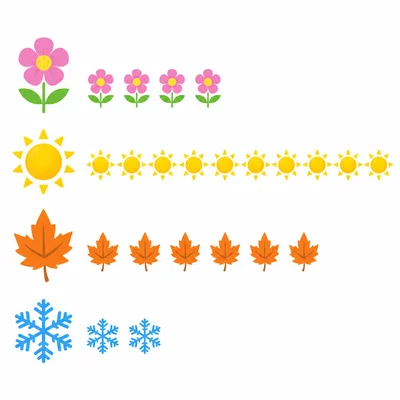
A class surveyed favorite seasons. Spring got 4 votes, summer got 11 votes, fall got 6 votes, and winter got 2 votes. Write the seasons in order from most votes to fewest votes.
- 8
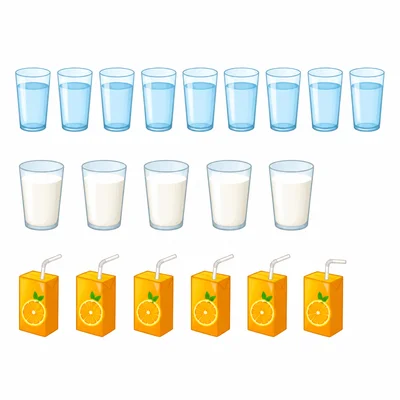
A survey asked, 'What is your favorite drink?' Water got 9 votes, milk got 5 votes, and juice got 6 votes. Did more students choose water or juice? How many more?
- 9
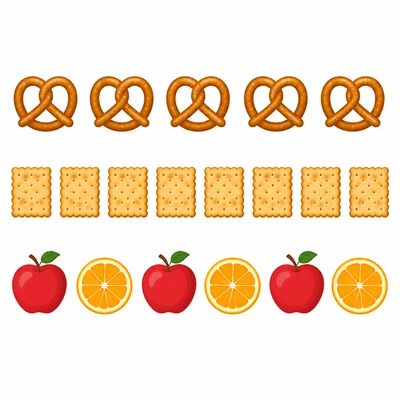
A class made a tally chart for favorite snacks. Pretzels had 5 tallies, crackers had 8 tallies, and fruit had 6 tallies. Which snack was chosen by 6 students?
- 10
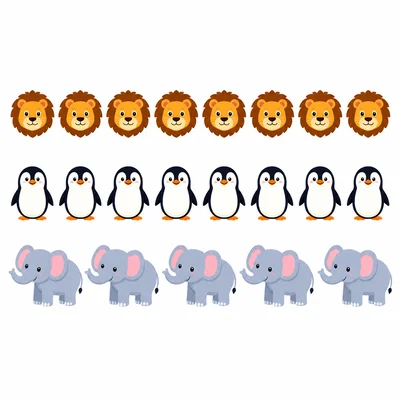
A survey asked students which animal they would like to see at the zoo. Lions got 8 votes, penguins got 8 votes, and elephants got 5 votes. How can you describe the result for lions and penguins?