Sign in to save

Bookmark this page so you can find it later.

Sign in to save

Bookmark this page so you can find it later.

Math middle-school May 21, 2026

Why Is Probability Not the Same as Luck?

How chance can be measured
A student compares a die, a coin, and a spinner to organize possible outcomes and probability

Luck is a word people use after something good or bad happens. Probability is a number that tells how likely an outcome is before it happens. You cannot control chance, but you can use probability to make better predictions over many tries.

Big Idea. Common Core 7.SP.C asks students to use probability models, compare expected and observed results, and explain chance events.

People often say they were lucky when a coin lands their way or when they win a game. That feeling is real, but it is not the same as probability. Probability is a way to describe chance with numbers. It starts before the result happens. If a fair coin is tossed, the probability of heads is $\frac{1}{2}$. That does not mean heads must happen next. It means heads should happen about half the time if the coin is tossed many times. Middle-school statistics asks students to compare what a model predicts with what actually happens. This is where the difference between luck and probability becomes useful. Luck explains a single surprising result. Probability helps you study a pattern of many results. It can help you judge games, surveys, risks, and everyday claims about chance.

Luck looks at one result
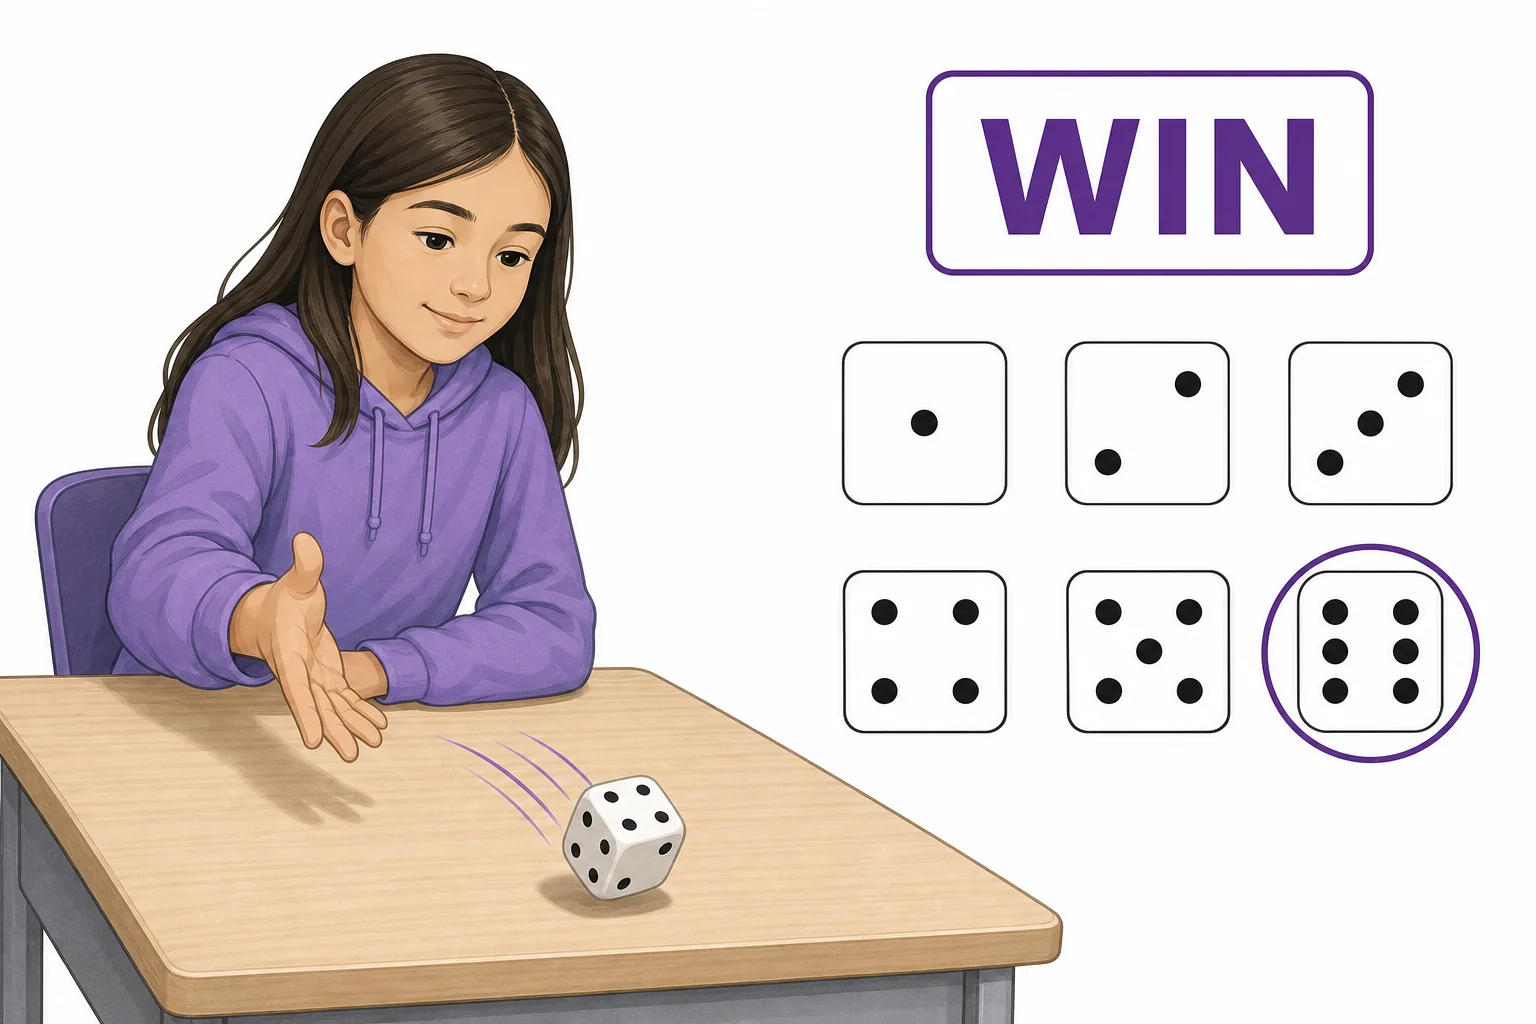
A fair die shows one favorable outcome, the six, among six possible faces
One roll can feel lucky, but the chance comes from all possible faces.
Luck is usually a story about one event. A player rolls a six at the exact moment they need it and says they were lucky. That may be true in ordinary speech, but math asks a different question. It asks how many outcomes were possible and how many were favorable. For a fair six-sided die, each face has the same chance. Rolling a six has probability $\frac{1}{6}$. The roll can still land on six the first time. It can also fail ten times in a row. Neither result changes the original probability. A single event can feel surprising because human attention focuses on the outcome that happened. Probability focuses on the whole set of possible outcomes before the event. This shift is important. It moves the conversation from feelings after the fact to a model that can be tested.

Luck describes what happened, while probability describes what could happen.

Probability starts with a sample space
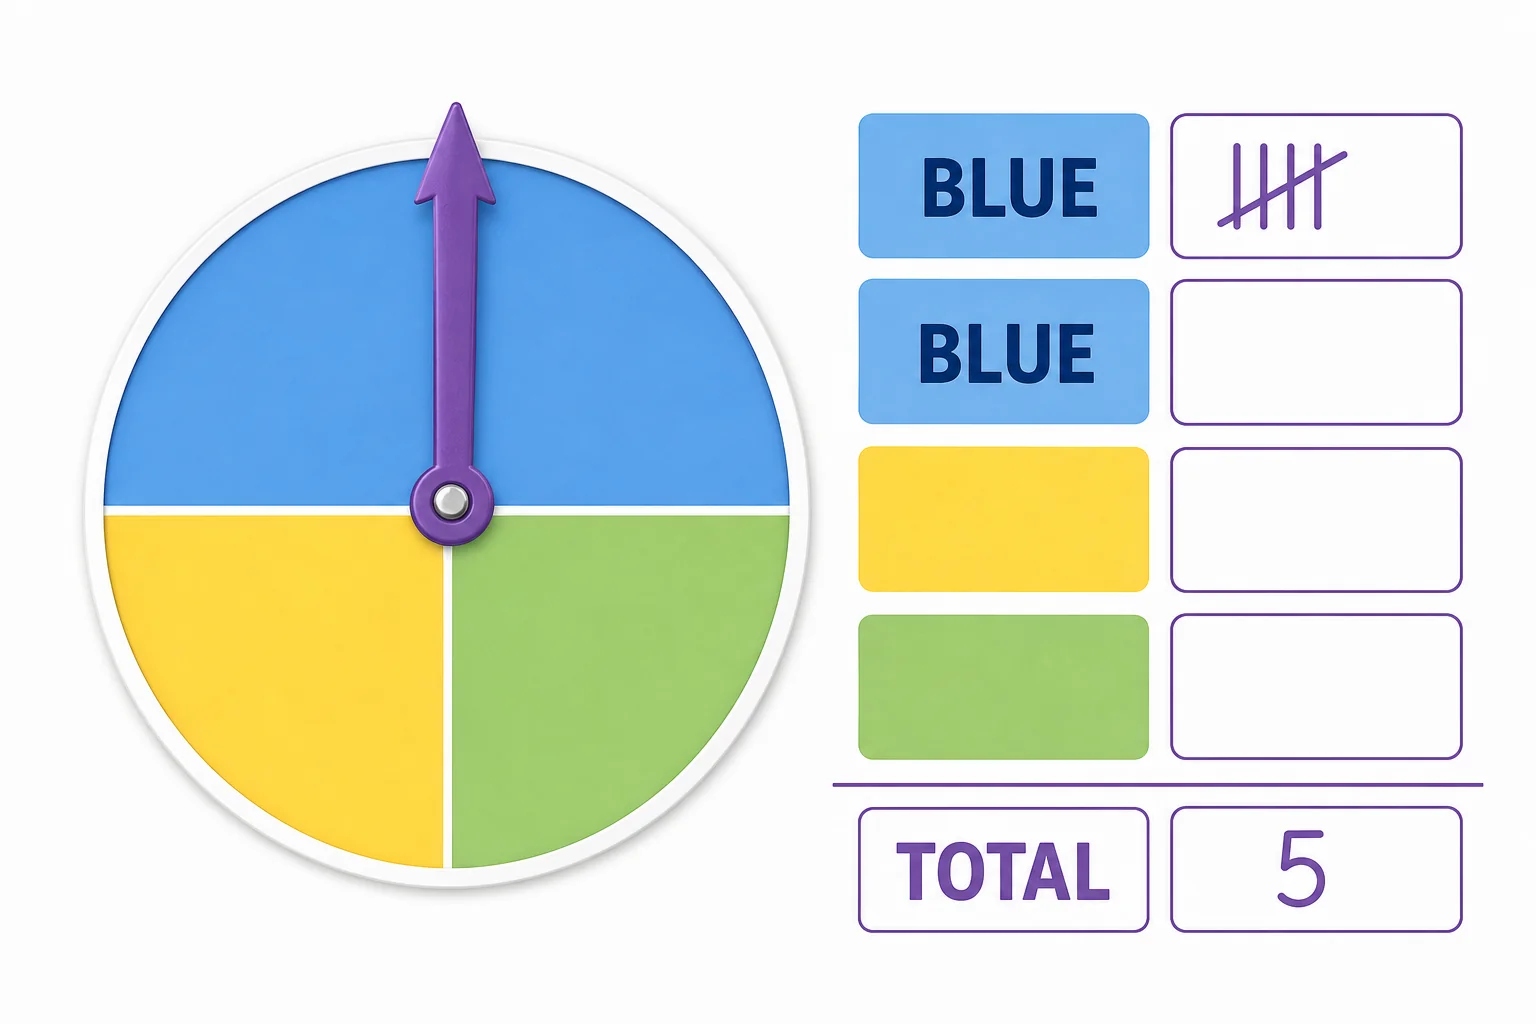
A spinner is divided into four equal parts, with two blue sections counted as favorable outcomes
A sample space lists every possible result before the spin.
A sample space is the list of all possible outcomes. It is the map that makes probability possible. For a coin, the sample space is heads and tails. For a standard die, it is 1 through 6. For a spinner split into four equal sections, it is the four sections. Once the sample space is clear, you can count favorable outcomes. If two of four equal spinner sections are blue, the probability of blue is $\frac{2}{4}$, which equals $\frac{1}{2}$. This is called theoretical probability because it comes from the design of the object, not from trials. The word fair matters. A spinner with unequal sections does not give each color the same chance. Probability is not guessing. It is counting outcomes and checking whether the model matches the situation.

A clear sample space turns chance into something you can count.

Experiments can be bumpy
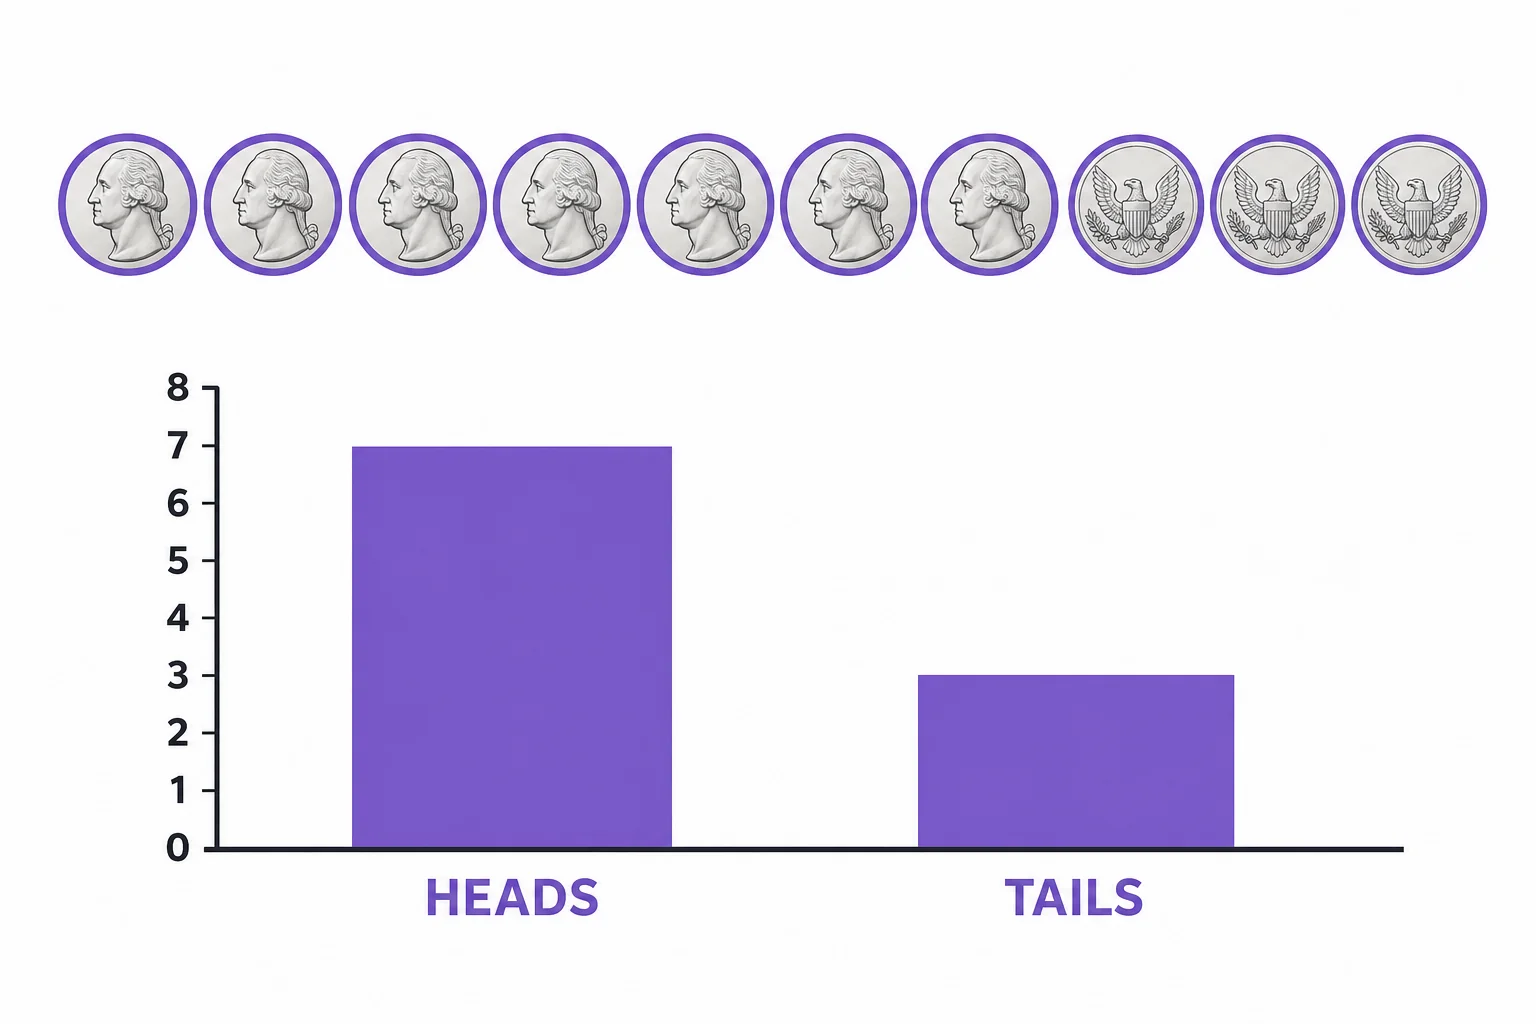
A simple bar chart compares heads and tails results from a small set of coin tosses
Small experiments often differ from the model.
Experimental probability comes from data. You run trials, record results, and compare the fraction you got with the theoretical probability. Suppose a coin lands heads 7 times in 10 tosses. The experimental probability of heads is $\frac{7}{10}$. That is not equal to the theoretical probability of $\frac{1}{2}$. This does not prove the coin is unfair. Ten tosses is a small sample, so the results can bounce around. If the same coin is tossed 1,000 times, the fraction of heads is more likely to be close to $\frac{1}{2}$. It still may not be exactly equal. Random results have variation. Probability does not remove that variation. It helps you decide whether the variation is normal or whether something unusual may be going on.

Short runs can look lucky even when the model is fair.

Large numbers reveal patterns
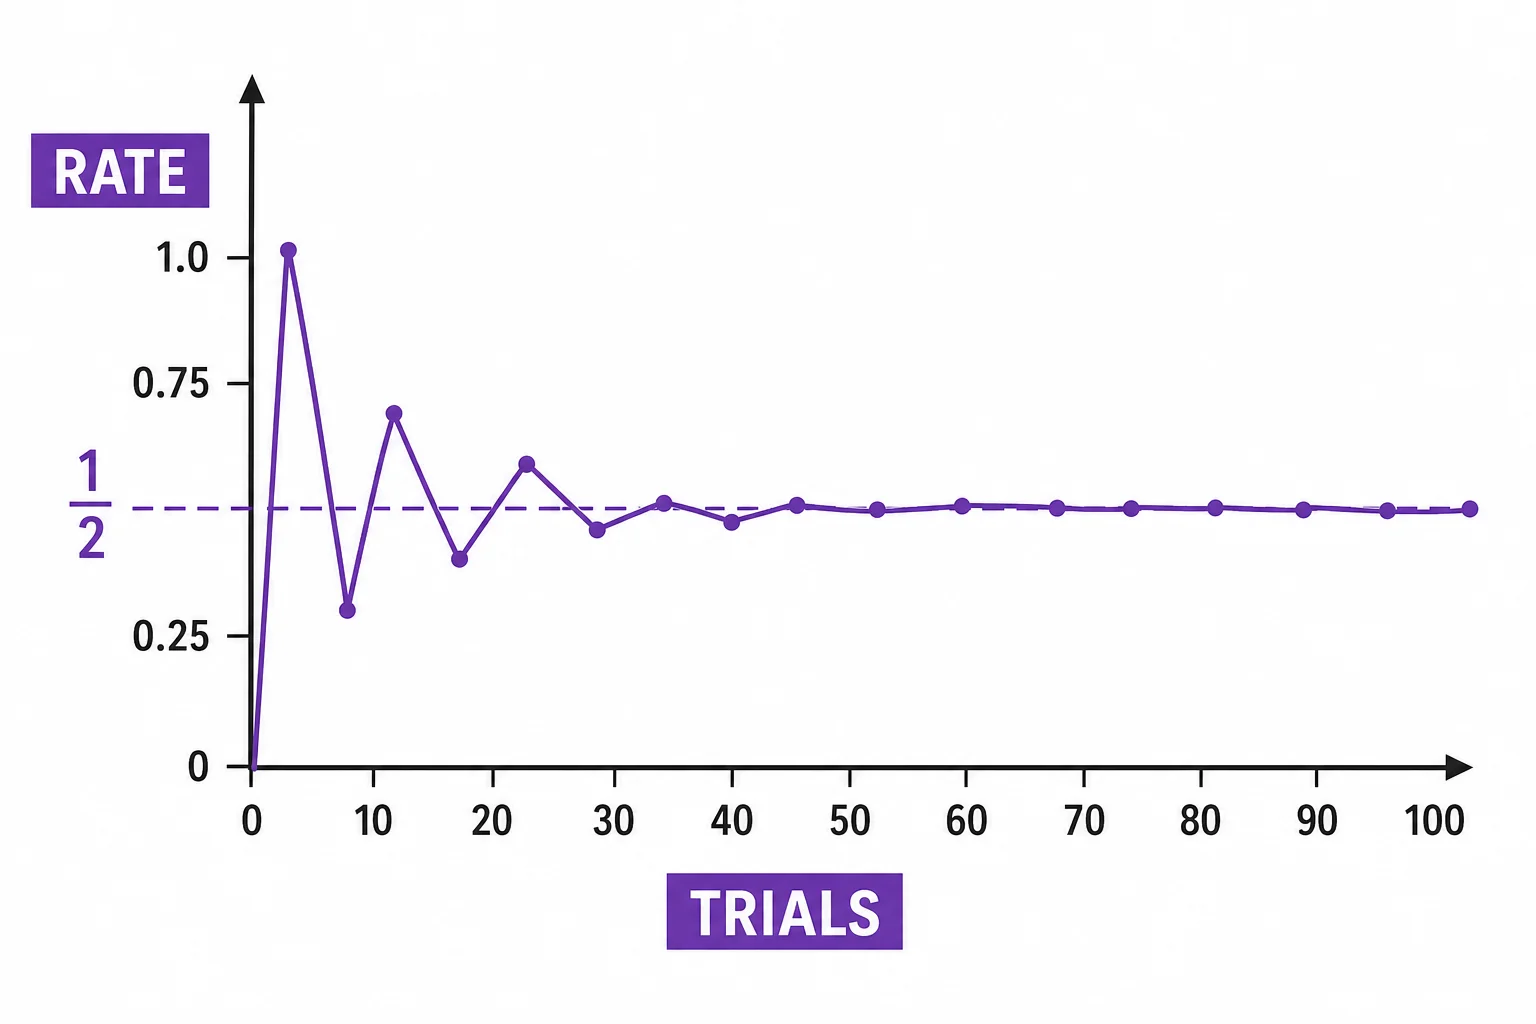
A line graph shows the fraction of heads moving closer to one half as the number of coin tosses increases
More trials usually make the long-run pattern easier to see.
The law of large numbers says that experimental results tend to get closer to the expected probability as the number of trials grows. This does not mean a result is due or that chance has a memory. If a coin lands tails five times in a row, heads is not guaranteed next. The next toss still has probability $\frac{1}{2}$, if the coin is fair. What changes with many trials is the overall fraction. A graph of coin toss results may jump around early, then settle near one half after hundreds or thousands of tosses. This is why probability is useful for predictions about groups of events. It is weak for naming the next exact result. It is stronger for estimating long-run patterns, such as game outcomes, quality checks, or survey results.

Probability predicts patterns better than it predicts one exact event.

Expected value is not a promise
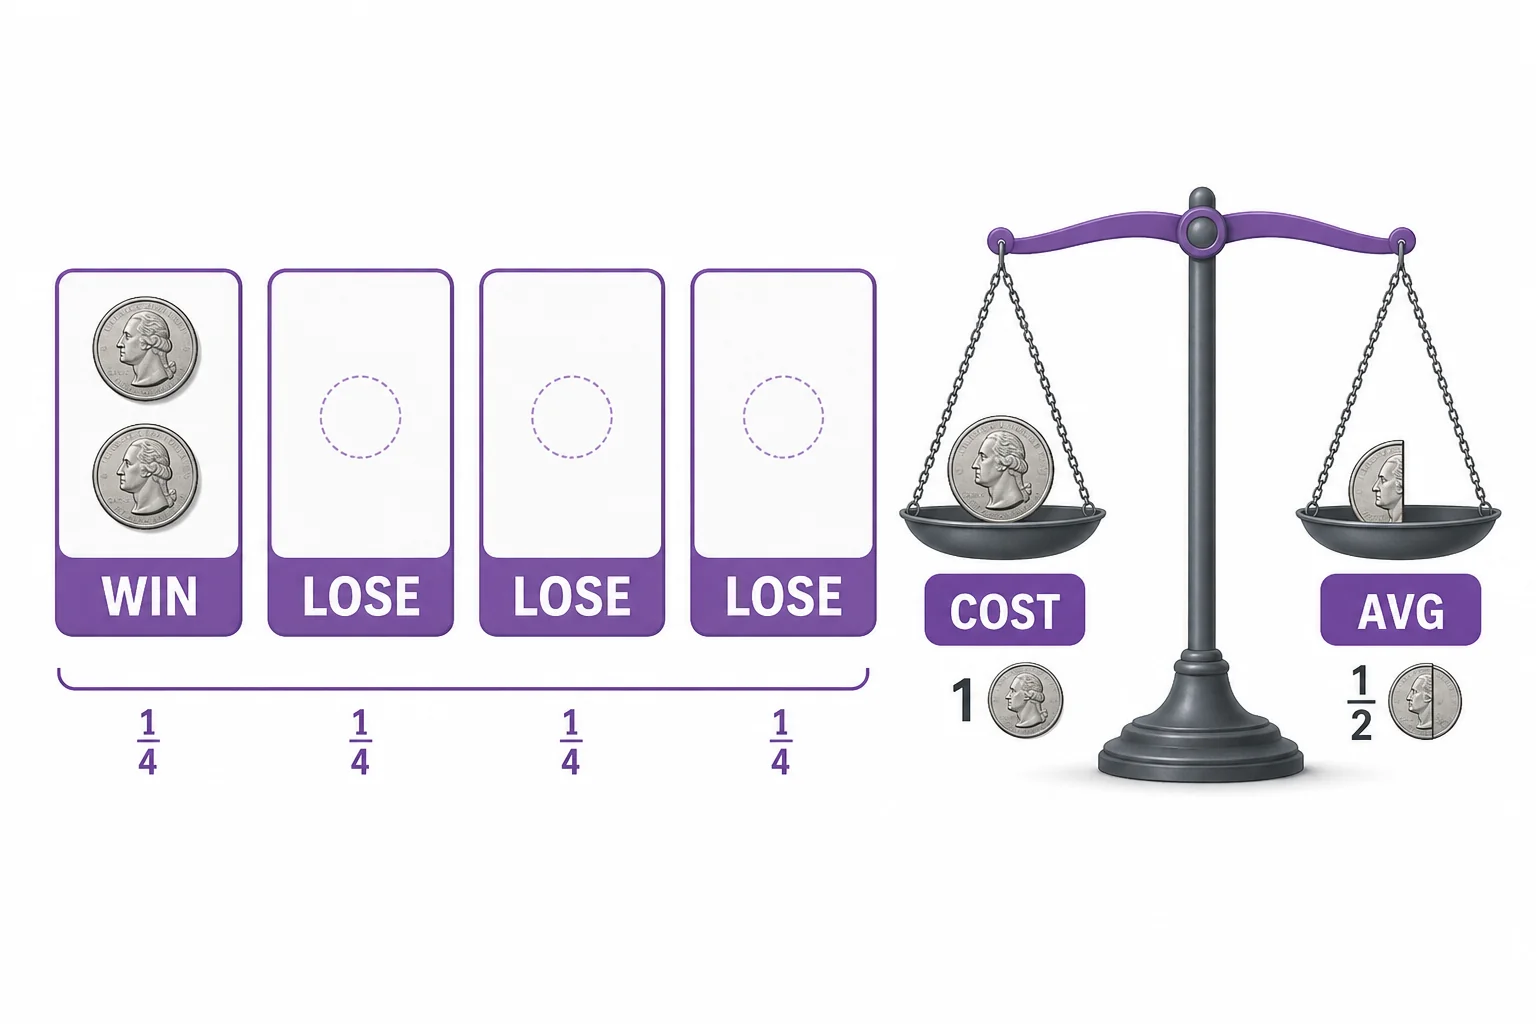
A probability game model shows one winning outcome and three losing outcomes, with coins representing the average payout
Expected value is the long-run average, not the next result.
Expected value is the average result you would expect over many trials. It is useful for judging games and choices that involve chance. Imagine a game costs 1 dollar to play. You have a $\frac{1}{4}$ chance to win 2 dollars and a $\frac{3}{4}$ chance to win 0 dollars. The average payout is $\frac{1}{4}\times2+\frac{3}{4}\times0$, which is 50 cents. Since the game costs 1 dollar, the expected result is a loss of 50 cents per play over time. One player can still win on one try and feel lucky. That does not make the game favorable. Expected value separates a lucky result from a good long-run deal. It is a math tool for asking whether chance is working for you on average.

A lucky win can happen in a game that is still a bad average bet.

Vocabulary

Probability
A number from 0 to 1 that describes how likely an outcome is.
Sample space
The set of all possible outcomes for a chance event.
Theoretical probability
A probability found from a model, often by counting equally likely outcomes.
Experimental probability
A probability found from data collected in repeated trials.
Law of large numbers
The idea that results from many trials tend to get closer to the expected probability.
Expected value
The long-run average result of a chance process.

In the Classroom

Coin toss model check

20 minutes | Grades 6-8

Students predict the number of heads in 20 tosses, then collect class data. They compare individual results with the combined class result and explain why the larger data set is usually closer to one half.

Design a fair spinner

30 minutes | Grades 7-8

Students create a spinner with a target probability for one color, such as $\frac{3}{8}$. They trade spinners, identify the sample space, and test the design with repeated spins.

Is the game worth playing

25 minutes | Grades 7-8

Students analyze a simple chance game with prizes and costs. They calculate expected value and decide whether a single win is enough evidence that the game is a good deal.

Key Takeaways

  • Luck is a way people describe a single result after it happens.
  • Probability is a number that describes chance before an event happens.
  • A sample space helps you count all possible outcomes.
  • Experimental results can differ from theoretical probability, especially with few trials.
  • Expected value describes a long-run average, not a guaranteed result.