Practice describing, summarizing, and interpreting data sets using common statistical measures and graphs.
Read each problem carefully. Show your work and explain your reasoning when needed.
Analyzing data with mean, median, mode, range, and displays
Math - Grade 6-8
- 1
Find the mean of this data set: 6, 8, 10, 12, 14.
- 2
Find the median of this data set: 3, 7, 9, 11, 15.
- 3
Find the mode of this data set: 4, 6, 6, 8, 9, 9, 9, 10.
- 4
Find the range of this data set: 18, 22, 25, 19, 30, 24.
- 5
Find the mean, median, mode, and range of this data set: 5, 7, 7, 8, 10, 13.
- 6
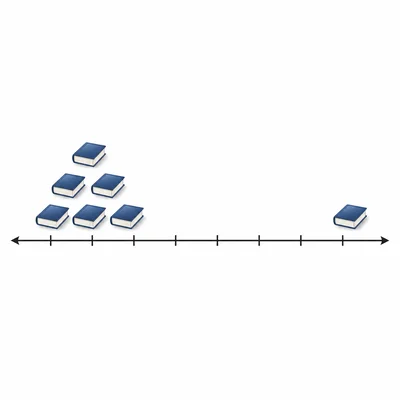
A student recorded the number of books read by 7 classmates: 2, 4, 4, 5, 6, 8, 11. Which measure of center, mean or median, better describes this data set, and why?
- 7
The temperatures for five days were 70, 72, 68, 74, and 71 degrees. Find the mean temperature.
- 8
This data set shows the number of goals scored in 8 games: 1, 3, 2, 4, 2, 5, 2, 3. Find the median and mode.
- 9
A line plot shows test scores of 72, 75, 75, 80, 84, 84, 84, and 90. Find the mode and range.
- 10
A data set has a mean of 12 for 4 numbers. What is the total of the 4 numbers?
- 11
A data set is 9, 12, 15, 18, 21. If each value increases by 3, what happens to the mean and median?
- 12
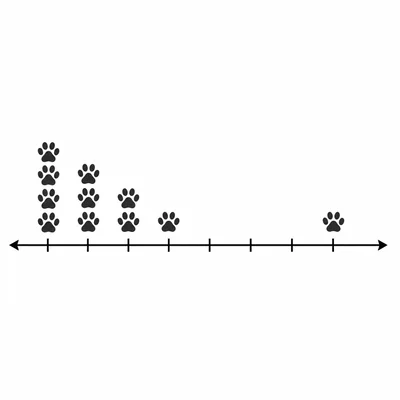
The table below shows the number of pets owned by students: 0, 1, 1, 2, 2, 2, 3, 5. Which is greater, the mean or the median?
- 13
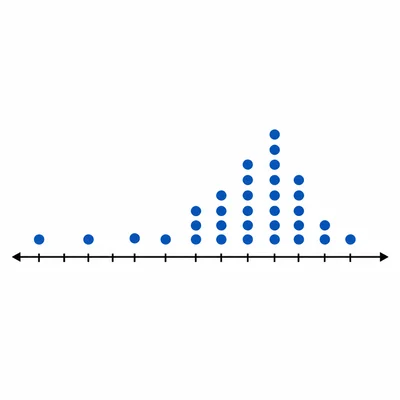
A class collected the following data for minutes spent reading: 10, 15, 20, 20, 25, 30, 30, 30, 35. Describe the distribution using center and spread.
- 14
A student says that the mode is always the best measure of center. Is the student correct? Explain.
- 15
The data set 14, 16, 18, 20, 22 has one more value added, and the new mean is 19. What number was added?