Gerrymandering & Districting Lab
The voters never change, but how you draw the district lines decides who wins seats. Split a grid of Purple and Orange voters into equal districts, where each district elects its own majority, and see how the same votes can produce very different results. Compare preset maps, draw your own, and measure how fair each plan is.
Guided ExperimentSame voters, different maps
The grid is 60% Purple. Predict how many of the 5 seats Purple should win if the map is fair, then predict whether a different map could change that.
Write your hypothesis in the Lab Report panel, then click Next.
Voter map
Each square is one voter. The dark lines are district borders. Click a square to move it into the district you are painting (district 1).
Small dots show each cell's district color.
Controls
Preset plans
District to paint
Click squares on the map to move them into the selected district. A plan only counts if every district has the same number of cells and stays connected.
Outcome
Vote share
Purple 60% · Orange 40%
Seats won
Purple 3 · Orange 2
Purple won 60% of the vote but 60% of the seats (3 of 5). Orange won 40% of the vote and 2 of 5 seats.
Efficiency gap
8.0%
Positive, so Purple wastes more votes than Orange. The map is biased toward Orange.
Wasted votes · Purple 6, Orange 4.
Compactness (cut edges)
16 cross-district borders. Fewer means a more compact map.
Plan status
Valid map
Data Table
(0 rows)| # | Plan | Purple seats | Orange seats | Purple vote(%) | Efficiency gap(%) | Cut edges |
|---|
Reference Guide
What Gerrymandering Means
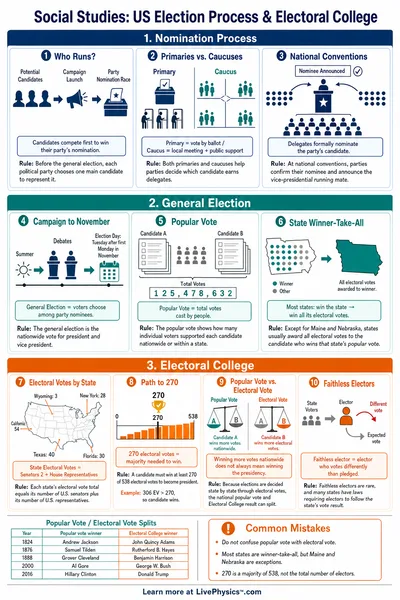
Many elections divide voters into districts, and each district sends one representative chosen by its own majority. Because only the local majority counts, the way the map is drawn can matter as much as how people vote.
Gerrymandering is drawing those boundaries on purpose to favor one side. The lab keeps the voters fixed at 60 percent Purple and 40 percent Orange, so any change in the seat split comes only from moving the lines, not from changing any vote.
Packing and Cracking
Packing means cramming as many of one group's voters as possible into a single district. They win that seat by a huge margin, but all the extra votes are wasted and they win fewer seats overall.
Cracking means splitting a group across many districts so they fall just short of a majority everywhere. With no district to win, a large group can end up with very few seats. The lab shows how each strategy can flip the seat count.
The Efficiency Gap
A vote is wasted when it does not help elect a winner. The losing side wastes every vote, and the winning side wastes every vote beyond the number needed to win. The efficiency gap is the difference in wasted votes between the two parties, divided by the total number of voters.
A gap near zero means both sides waste votes about equally, which looks fair. A large gap means one side wastes far more, a sign the map favors the other side. It is one neutral, number-based way to flag a tilted map.
Fair Rules and Compactness
Real districts follow rules. In this lab a plan only counts if every district has the same number of voters and stays connected, so you cannot draw a district out of scattered, unconnected pieces.
The lab also counts cut edges, the number of borders between cells in different districts. A lower count means a more compact, blockier map. Strangely shaped maps with many cut edges are often a clue that the lines were drawn to chase a result.