Practice analyzing population growth patterns, limiting factors, logistic growth, exponential growth, and carrying capacity in ecosystems.
Read each problem carefully. Show your work when calculations are needed, and explain your reasoning in complete sentences.
Modeling how populations change over time
Biology - Grade 9-12
- 1
Define population growth and explain why it is important in ecology.
- 2
A rabbit population has 120 individuals at the start of spring. During spring, 45 rabbits are born, 18 die, 6 move into the area, and 3 leave the area. What is the population size at the end of spring?
- 3
In one year, a population of 500 fish increases to 575 fish. Calculate the percent growth for that year.
- 4
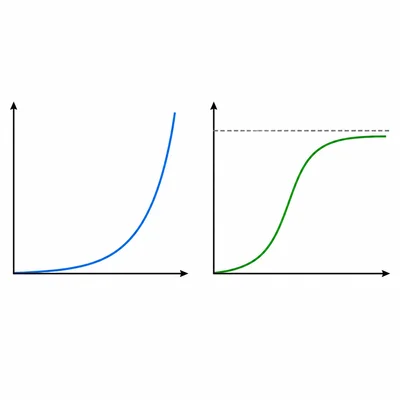
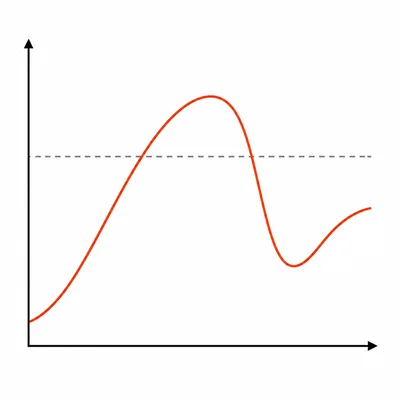
Compare exponential growth and logistic growth. Include the typical shape of each graph and what happens to the population over time.
- 5
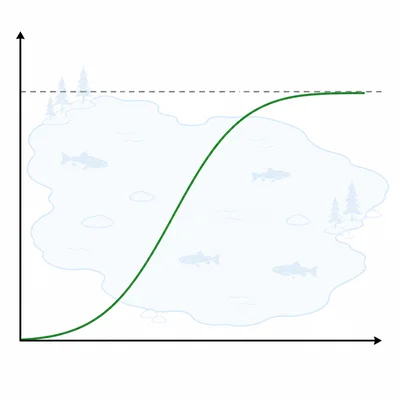
A lake can support about 2,000 adult trout over many years. What term describes this maximum long-term population size, and what does it mean?
- 6
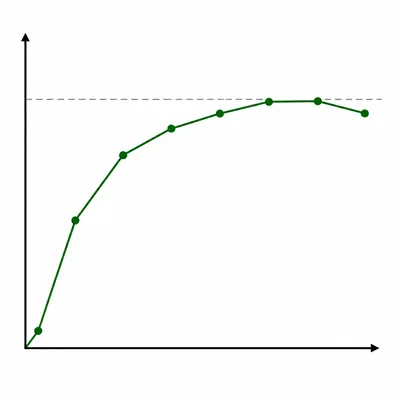
The table shows a deer population over time: Year 1: 80, Year 2: 150, Year 3: 275, Year 4: 430, Year 5: 560, Year 6: 615, Year 7: 635, Year 8: 630. Estimate the carrying capacity and explain your reasoning.
- 7
Classify each limiting factor as density-dependent or density-independent: competition for food, drought, disease spread, wildfire.
- 8
A population of bacteria grows according to the logistic model growth rate = rN(1 - N/K). If r = 0.4, N = 200, and K = 1,000, what is the growth rate?
- 9
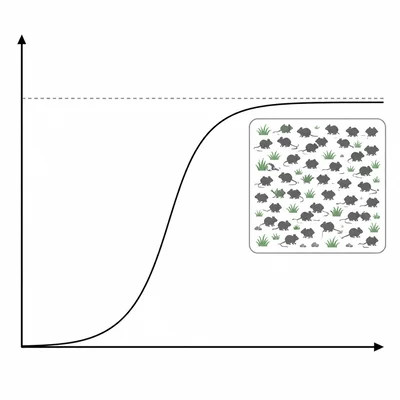
Using the logistic growth model, explain why a population grows more slowly when N is close to K.
- 10
An island has abundant nesting sites and food after a storm removes many competitors. A bird population introduced to the island increases from 10 birds to 20, then 40, then 80 over equal time intervals. What type of growth is shown, and why?
- 11
Describe what can happen when a population overshoots its carrying capacity.
- 12
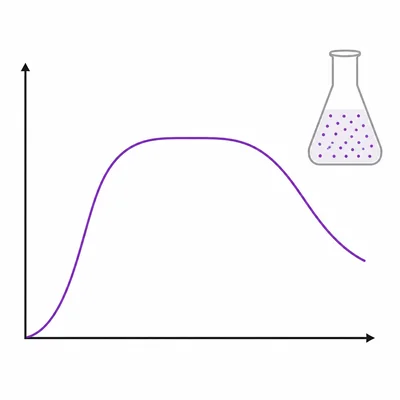
A graph of a yeast population shows a rapid increase for several hours, then a plateau, then a decline. Explain one likely reason for each part of the pattern.
- 13
How can human activities increase or decrease the carrying capacity of an environment for a species? Give one example of each.
- 14
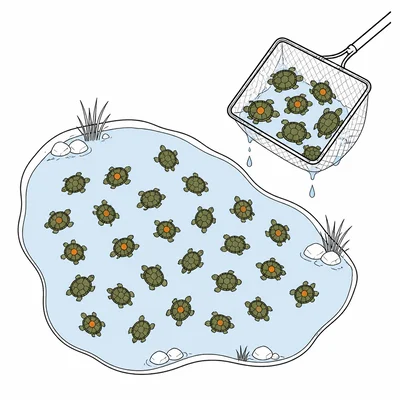
Scientists capture and mark 40 turtles in a pond. Later, they capture 50 turtles and find that 10 are marked. Use mark-recapture to estimate the pond's turtle population.
- 15
A wildlife manager sees that a grassland's bison population has been above carrying capacity for two years. The grass is overgrazed, birth rates are falling, and young bison survival is low. Recommend one management action and explain how it could help.