Analyze how climate models work, how scientists test them, and how model predictions are used to compare possible climate futures.
Read each problem carefully. Use complete sentences when explaining your reasoning. Show calculations when needed.
Using evidence, scenarios, and uncertainty to understand future climate
Environmental Science - Grade 9-12
- 1
Describe two major types of data that scientists use as inputs for climate models.
- 2
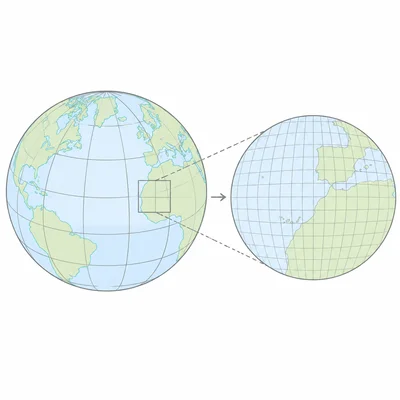
A climate model divides Earth into grid cells. Explain why using smaller grid cells can improve a model, and describe one drawback of using smaller grid cells.
- 3
Explain the difference between a climate prediction and a weather forecast.
- 4
A model estimates that global average temperature will rise by 2.4 degrees Celsius by 2100 under a high-emissions scenario and 1.3 degrees Celsius under a low-emissions scenario. Calculate the difference between the two projections and explain what it means.
- 5
In climate science, explain why future greenhouse gas emissions are often described with scenarios instead of one guaranteed prediction.
- 6
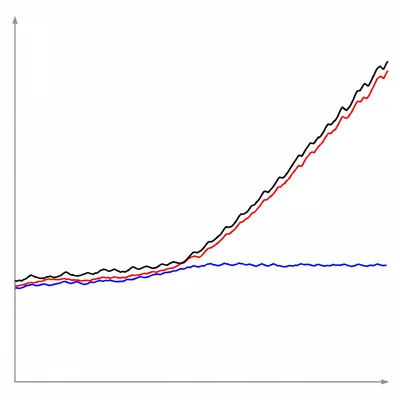
A graph shows global temperature from 1900 to 2020. The model run that includes both natural factors and human-caused greenhouse gases closely matches the observed warming, while the model run with only natural factors stays nearly flat after 1950. What conclusion is supported by this comparison?
- 7
Define climate feedback and give one example of a positive climate feedback.
- 8
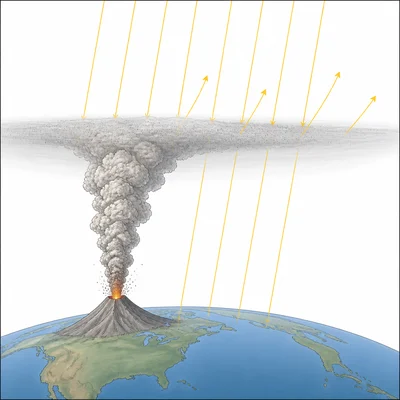
Aerosols from volcanic eruptions can reflect sunlight back into space. Predict how a major volcanic eruption might affect global average temperature for a short time, and explain why.
- 9
Climate models are often tested by running them on past climate conditions and comparing the results to historical observations. Explain why this is useful.
- 10

A model ensemble uses 30 different model runs. Twenty-six runs show warming between 1.8 and 2.6 degrees Celsius by 2050, while four runs show warming outside that range. Explain why scientists use an ensemble instead of relying on one model run.
- 11
Use the data table: Scenario A has projected 2100 CO2 concentration of 450 ppm and projected warming of 1.6 degrees Celsius. Scenario B has projected 2100 CO2 concentration of 700 ppm and projected warming of 3.2 degrees Celsius. Identify the relationship shown by the data.
- 12
Explain why regional climate predictions, such as rainfall in one city, are often more uncertain than global average temperature predictions.
- 13
A coastal city uses climate model projections to plan for sea level rise. List two decisions the city might make using these projections.
- 14
A student says, "Climate models cannot be trusted because they do not predict the exact temperature on every future day." Write a response that corrects this misunderstanding.
- 15
Create a short claim supported by evidence: Climate models are useful for decision-making even though they include uncertainty.