Sign in to save

Bookmark this page so you can find it later.

Sign in to save

Bookmark this page so you can find it later.

Carbon Footprint Calculator

Estimate your annual CO₂ emissions from transportation, home energy, diet, and lifestyle choices. Compare your footprint against country averages and see what it takes to offset it.

Transportation

mi/yr
flights
flights

Home Energy

kWh
therms
months

Diet

Lifestyle

19.55
metric tons CO₂ per year
near US average
22% above US average
931
trees to offset
per year
48.4k
equivalent miles
in gasoline car
46.5k
kWh equivalent
electricity
53.6
kg CO₂/day
daily average

Breakdown by Category

19.5tons CO₂
Transport7.02 t
36%
Energy7.87 t
40%
Diet2.50 t
13%
Lifestyle2.16 t
11%

Country Comparison

Your Footprint
19.5t
United States
16.0t
Australia
14.7t
Canada
13.6t
Germany
7.9t
World Avg
4.6t
India
1.9t

All values in metric tons CO₂ per person per year.

Reference Guide

Carbon Footprint

A carbon footprint is the total amount of greenhouse gases produced directly and indirectly by human activities, expressed in equivalent metric tons of CO₂ per year.

The average American emits about 16 metric tons of CO₂ per year, roughly four times the global average of 4.6 tons. Scientists suggest each person should aim for under 2 tons by 2050 to limit warming to 1.5°C.

United States16.0 t CO₂/yr Australia14.7 t CO₂/yr Germany7.9 t CO₂/yr World average4.6 t CO₂/yr India1.9 t CO₂/yr Target (2050)< 2.0 t CO₂/yr

Greenhouse Gases

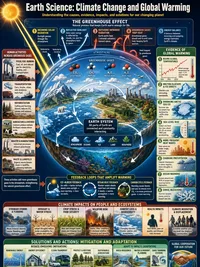
Greenhouse gases (GHGs) trap heat in the atmosphere. CO₂ is the most abundant, but methane (CH₄) is 28× more potent over 100 years, and nitrous oxide (N₂O) is 265× more potent. All are reported as CO₂ equivalent (CO₂e).

Burning one gallon of gasoline produces about 8.9 kg of CO₂. A single transatlantic flight emits roughly 1.5 tons CO₂e per passenger, comparable to several months of home energy use.

1 gal gasoline8.9 kg CO₂ 1 therm natural gas5.3 kg CO₂ 1 kWh electricity (US)0.42 kg CO₂ 1 mile gasoline car0.40 kg CO₂

Reducing Emissions

The biggest reductions typically come from transportation and diet. Switching from a gasoline car to an EV can save 1.5 to 3 tons CO₂ per year, depending on your grid. Avoiding one long-haul flight saves about 1.5 tons CO₂e.

Diet changes can reduce emissions by 0.5 to 1.5 tons per year. Shifting from heavy meat consumption to a plant-based diet is one of the highest-impact personal choices available.

EV vs gas carsave 1.5-3 t/yr Skip one long flightsave ~1.5 t Vegan vs heavy meatsave ~1.8 t/yr Solar panels (home)save 1-2 t/yr

Carbon Offsets

Carbon offsets allow individuals and organizations to compensate for emissions by funding equivalent CO₂ reductions elsewhere, such as reforestation, renewable energy projects, or methane capture.

A mature tree absorbs roughly 21 kg of CO₂ per year. To offset the US average of 16 tons, you would need about 762 trees growing for an entire year. Offset prices range from $10 to $50 per ton through verified programs like Gold Standard and VCS.

1 mature treeabsorbs ~21 kg/yr Offset 16 t (US avg)~762 trees/yr Verified offset price$10-50 per ton 1 acre forest~2.5 t CO₂/yr

Related Content

Related Tools

Earthquake Magnitude Calculator
Four modes: magnitude scales (Richter Mₗ, moment magnitude M𝑤, energy), energy comparison (each step = 31.6× more energy, logarithmic bar chart), Modified Mercalli Intensity I-XII with descriptions, and Richter magnitude from seismograph amplitude. Presets include Minor M3 through Great M8, 1906 San Francisco M7.9, and 2011 Japan M9.1.
Star Lifecycle Visualizer
Three modes: interactive HR diagram with 23 real stars (click to see properties), stellar evolution pathway from nebula to end state (white dwarf, neutron star, or black hole based on initial mass), and star properties calculator (luminosity L∝M^3.5, radius, lifetime t∝M^-2.5, apparent magnitude). Six presets: Sun, Red Dwarf (0.3 M☉), Sirius A (2 M☉), Blue Giant (20 M☉), Betelgeuse (15 M☉), Supergiant (50 M☉). Includes spectral class colour strip and SVG star visualization.
H-R Diagram Explorer
Three modes: plot a single star on the Hertzsprung-Russell diagram from temperature, radius, and mass (Stefan-Boltzmann luminosity, spectral class O-M, absolute magnitude, HR region); compare multiple stars side by side; and browse the spectral atlas with typical properties for each class. 23 reference stars plotted, 6 presets from Proxima Centauri to Rigel.
Spectroscopy & Redshift Explorer
Two modes: view emission spectra for hydrogen (Balmer series), helium, sodium, neon, and mercury with color-coded spectral lines on a visible-spectrum SVG; and calculate redshift z, recession velocity, Hubble-law distance, and lookback time from rest and observed wavelengths. Six presets from nearby galaxies to quasars.