Practice using left, right, and midpoint Riemann sums, interpreting signed area, and connecting Riemann sums to definite integrals.
Read each problem carefully. Show your setup and calculations in the space provided.
Approximating area and connecting sums to integrals
Math - Grade 9-12
- 1
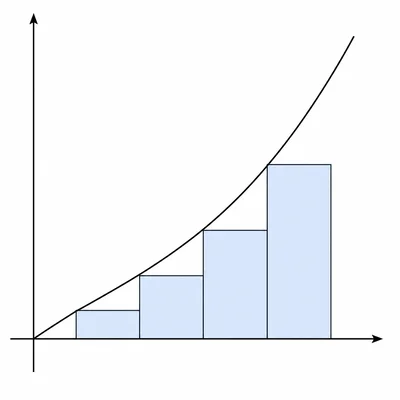
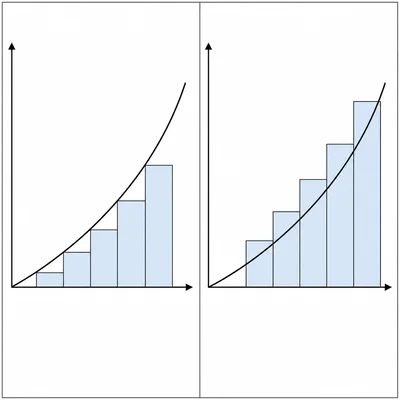
Use a left Riemann sum with 4 equal subintervals to approximate the area under f(x) = x^2 on the interval [0, 4].
- 2
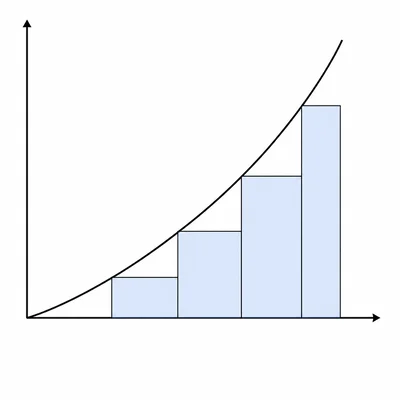
Use a right Riemann sum with 4 equal subintervals to approximate the area under f(x) = x^2 on the interval [0, 4].
- 3
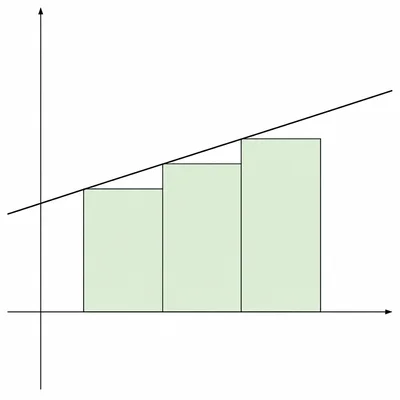
Use a midpoint Riemann sum with 3 equal subintervals to approximate the area under f(x) = 2x + 1 on the interval [0, 6].
- 4
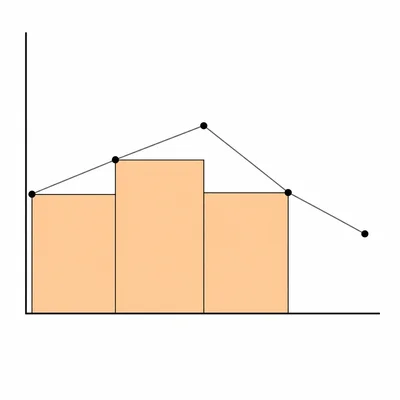
A moving object has velocity values shown at times t = 0, 2, 4, 6, and 8 seconds: v(t) = 3, 5, 6, 4, and 2 meters per second. Use a left Riemann sum with 4 subintervals to estimate the object's displacement from t = 0 to t = 8.
- 5
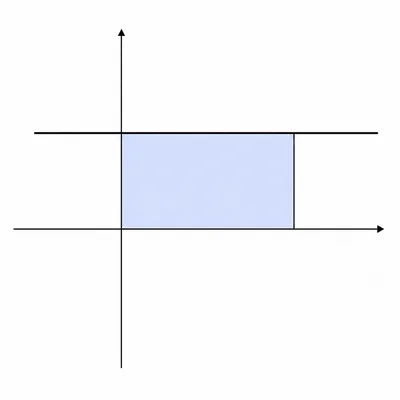
Find the exact value of the definite integral of f(x) = 3 from x = 0 to x = 5.
- 6
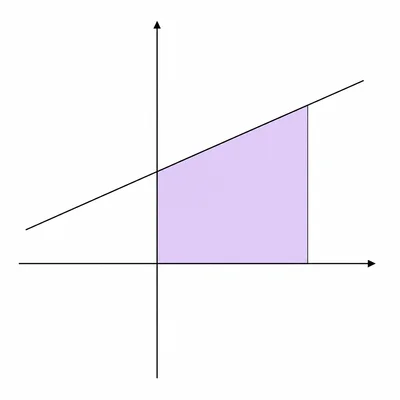
Find the exact value of the definite integral of f(x) = x + 2 from x = 0 to x = 3 using geometry.
- 7
Write the limit definition of the definite integral of f(x) on [a, b] using right endpoints.
- 8
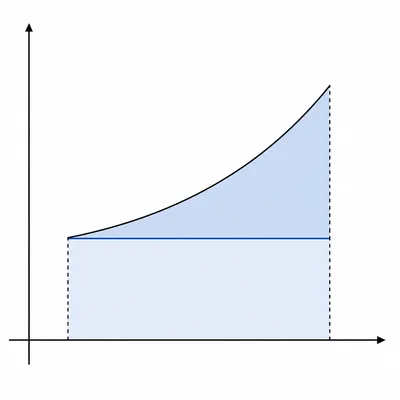
Suppose f(x) is increasing and positive on [a, b]. Explain whether a left Riemann sum gives an overestimate or an underestimate, and explain whether a right Riemann sum gives an overestimate or an underestimate.
- 9
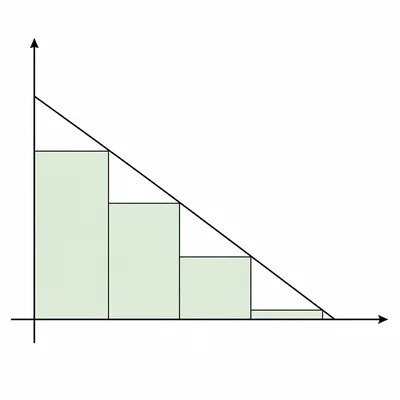
Use a right Riemann sum with 4 equal subintervals to approximate the area under f(x) = 4 - x on the interval [0, 4]. Then state whether the estimate is less than or greater than the exact area.
- 10
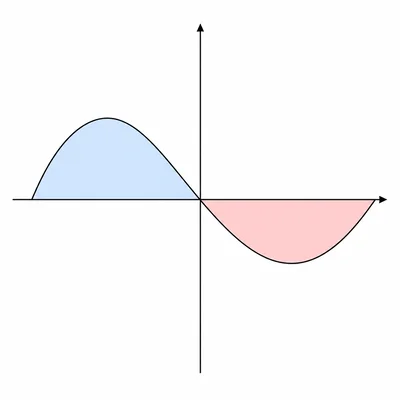
A graph has 12 square units of area above the x-axis from x = 0 to x = 3 and 5 square units of area below the x-axis from x = 3 to x = 5. Find the value of the definite integral from x = 0 to x = 5.
- 11
Find the average value of f(x) = x^2 on the interval [0, 3].
- 12
The sum from i = 1 to 5 of [(1 + 2i/5)^2](2/5) is a right Riemann sum. Identify the function, interval, and number of subintervals.
- 13
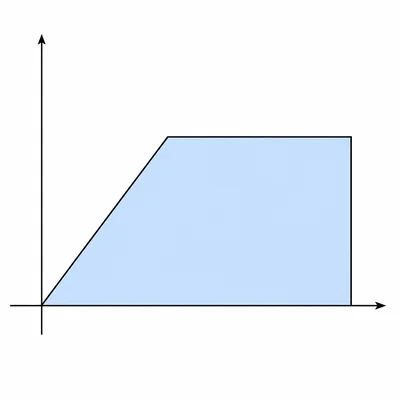
A graph of f has a line segment from (0, 0) to (2, 4), then a horizontal line segment from (2, 4) to (5, 4). Find the definite integral of f from x = 0 to x = 5 using geometry.
- 14
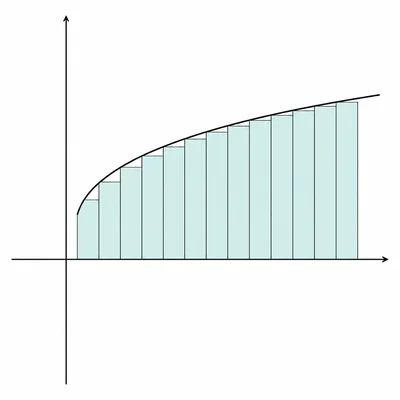
Write a left Riemann sum with n subintervals for f(x) = square root of x on the interval [1, 5]. Do not evaluate the limit.
- 15
Evaluate the definite integral of 3x^2 + 1 from x = 0 to x = 2.