Practice reading charts, graphs, and tables to answer social studies questions about communities, regions, and population data.
Read each chart, graph, or table description carefully. Answer each question using the information given. Show your thinking when needed.
Using data displays to understand information about people and places
Social Studies - Grade 4-5
- 1
A table shows the number of students who walk to school in four grades. Grade 3: 18, Grade 4: 22, Grade 5: 20, Grade 6: 15. Which grade has the greatest number of students who walk to school?
- 2
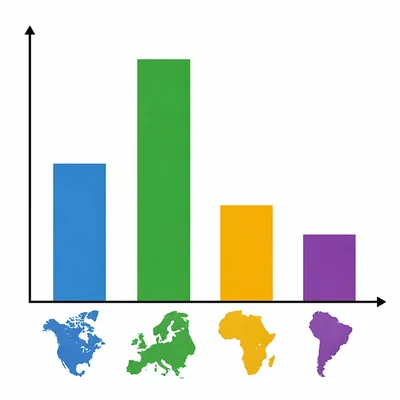
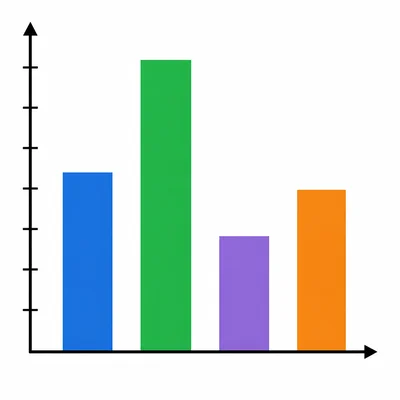
A bar graph shows the number of books in a town library about different regions. North America: 12, South America: 7, Europe: 15, Africa: 9. How many more books are there about Europe than South America?
- 3

A table shows the population of three small towns. Pine Hill: 450 people, Lake Town: 620 people, River Bend: 590 people. Which town has the smallest population?
- 4
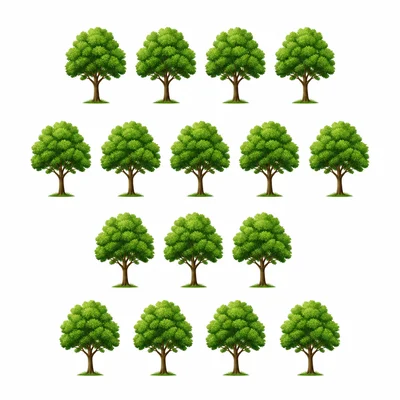
A pictograph shows the number of parks in four neighborhoods. Each tree symbol stands for 2 parks. Eastside has 3 trees, Westside has 5 trees, Southside has 4 trees, and Northside has 2 trees. How many parks does Westside have?
- 5
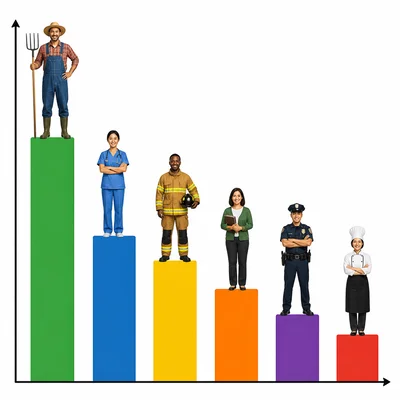
A chart shows the kinds of jobs people do in one community. Farmers: 14, Teachers: 9, Store Owners: 6, Firefighters: 5. Which job is the most common in this community?
- 6
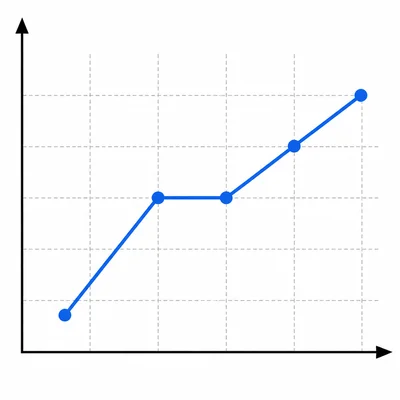
A line graph shows the number of visitors to a local museum during four months. January: 40, February: 55, March: 55, April: 70. During which two months did the museum have the same number of visitors?
- 7
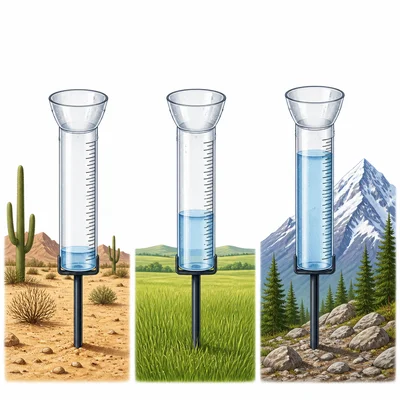
A table shows rainfall in three regions. Desert Region: 2 inches, Plains Region: 10 inches, Mountain Region: 14 inches. Which region had the most rainfall?
- 8
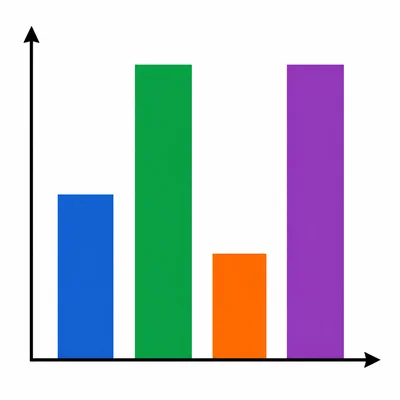
A bar graph shows how many people visited four state parks last weekend. Park A: 120, Park B: 150, Park C: 90, Park D: 150. Which two parks had the same number of visitors?
- 9
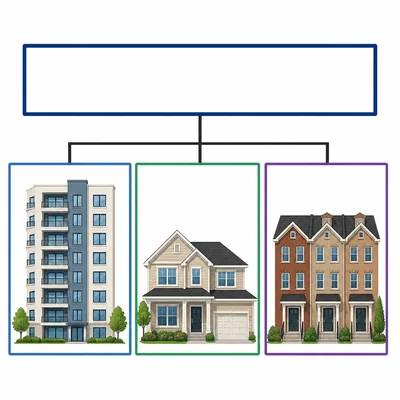
A table shows the number of homes in a town by type. Apartments: 35, Houses: 48, Townhouses: 17. How many homes are listed in all?
- 10
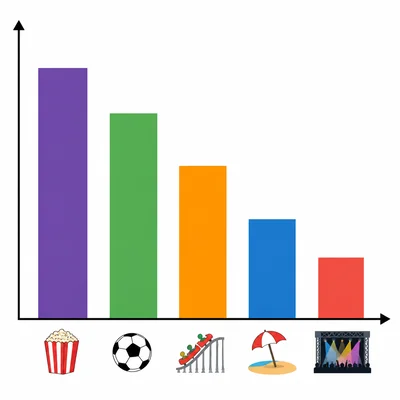
A chart shows favorite community events chosen by students. Parade: 16 votes, Farmers Market: 11 votes, Art Fair: 13 votes, Concert: 9 votes. Which event received the fewest votes?
- 11
A table shows the distance from a school to four places in town. Library: 2 miles, Fire Station: 1 mile, City Hall: 3 miles, Post Office: 2 miles. Which place is closest to the school?
- 12
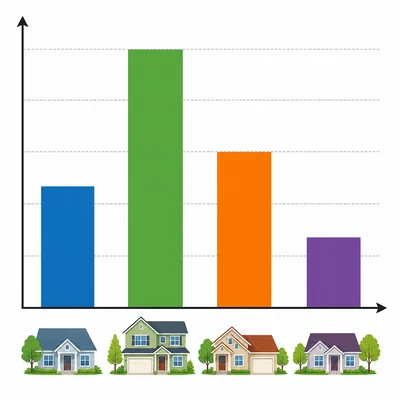
A bar graph shows the number of people who moved into a neighborhood over three years. Year 1: 24, Year 2: 30, Year 3: 27. In which year did the most people move into the neighborhood, and how many people was that?