Practice calculating and interpreting descriptive statistics, including mean, median, mode, range, interquartile range, variance, standard deviation, and outliers.
Read each problem carefully. Show your work in the space provided and include units when appropriate.
Summarizing data with center, spread, and shape
Statistics - Grade 9-12
- 1
The following data show the number of text messages sent by 8 students in one day: 12, 25, 18, 30, 25, 40, 10, 20. Find the mean number of text messages.
- 2
The following test scores are listed in order: 68, 72, 75, 80, 84, 88, 91. Find the median score and explain what it represents.
- 3
A small data set is 4, 7, 7, 9, 10, 10, 10, 12. Find the mode and explain how you know.
- 4
The daily high temperatures in degrees Fahrenheit for one week were 62, 65, 70, 68, 66, 64, 71. Find the range.
- 5
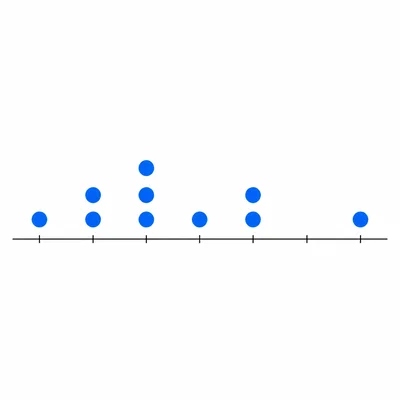
The dot plot shows the number of books read by students last month. The data values are 0, 1, 1, 2, 2, 2, 3, 4, 4, 6. Find the median and describe the shape of the distribution.
- 6
The following data show the number of minutes 9 students spent studying: 15, 20, 20, 25, 30, 35, 40, 45, 90. Which measure of center, mean or median, better represents the typical study time? Explain.
- 7
Find the five-number summary for this data set: 3, 5, 7, 8, 10, 12, 13, 15, 18.
- 8
Use the five-number summary from the data set 3, 5, 7, 8, 10, 12, 13, 15, 18 to find the interquartile range.
- 9
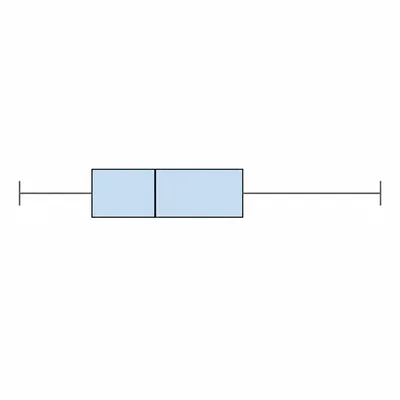
A box plot has a minimum of 12, Q1 of 18, median of 25, Q3 of 32, and maximum of 45. What is the interquartile range, and what does it tell you?
- 10
The prices in dollars of 6 used calculators are 18, 20, 22, 24, 26, and 28. Find the population variance.
- 11
Using the same calculator prices 18, 20, 22, 24, 26, and 28, find the population standard deviation and interpret it.
- 12
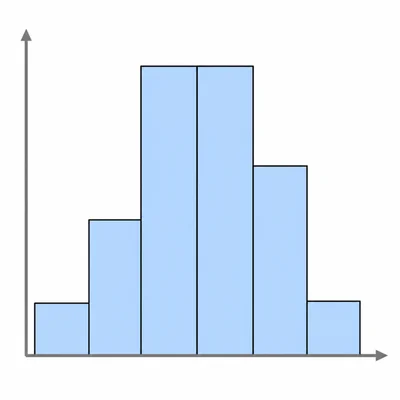
A histogram shows the number of minutes students spent exercising in one day. Most students are in the 20 to 30 minute and 30 to 40 minute intervals, with fewer students in the 0 to 10 and 50 to 60 minute intervals. Describe the overall shape of the distribution.
- 13
A data set has Q1 = 22 and Q3 = 38. Use the 1.5 × IQR rule to find the lower and upper fences for identifying outliers.
- 14
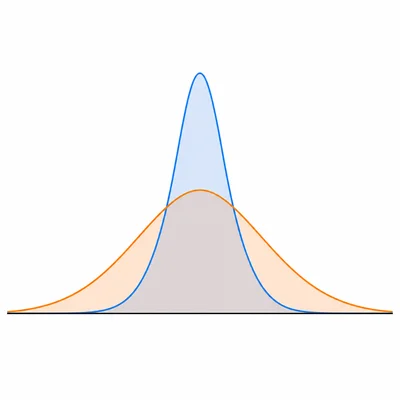
Two classes took the same quiz. Class A has a mean score of 82 and a standard deviation of 4. Class B has a mean score of 82 and a standard deviation of 12. Compare the two classes.
- 15
A student scored 78 on a test where the class mean was 70 and the standard deviation was 4. Find the student's z-score and interpret it.