Practice deciding when to use non-parametric tests, ranking data, and interpreting results when normality or other assumptions fail.
Read each problem carefully. Identify the situation, choose an appropriate non-parametric method when needed, and show your work in the space provided.
Choosing and using rank-based tests when standard assumptions are not met
Statistics - Grade 9-12
- 1
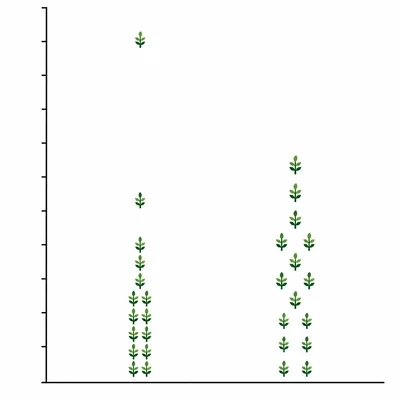
A biology class compares the plant heights from two independent groups. Group A used regular water and Group B used fertilizer. The sample sizes are small, and the height data are strongly skewed with one extreme outlier. Should the class use a two-sample t-test or the Mann-Whitney U test? Explain your choice.
- 2
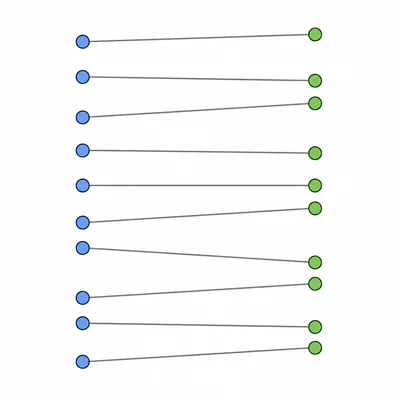
A teacher records student stress ratings before and after a mindfulness activity. The ratings are on a 1 to 5 scale, and the same students are measured twice. Which non-parametric test is more appropriate: Mann-Whitney U or Wilcoxon signed-rank? Explain.
- 3
Rank the following values from smallest to largest. Use average ranks for ties: 12, 9, 12, 15, 10.
- 4
Two independent groups have the following scores. Group A: 5, 7, 9. Group B: 1, 4, 6. Rank all six values together and calculate the Mann-Whitney U statistic for Group A. Use U_A = R_A - n_A(n_A + 1)/2.
- 5
Using the same data from the previous problem, Group A has U_A = 8. There are 3 scores in each group, so n_A n_B = 9. Find U_B and the smaller U statistic used for the Mann-Whitney U test.
- 6
A paired study has the following differences after minus before: 2, -1, 3, 0, 4. For a Wilcoxon signed-rank test, ignore the zero difference, rank the absolute differences, and find W+ and W-.
- 7
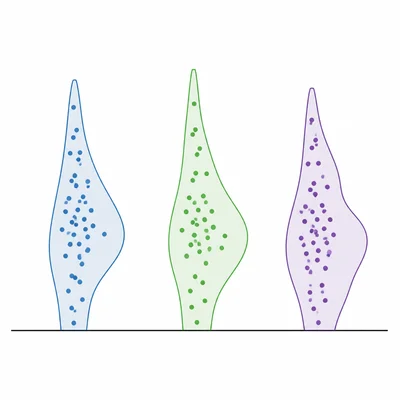
A researcher compares reaction times for three independent groups: no music, classical music, and loud music. The distributions are skewed, and the researcher wants to compare typical performance across all three groups. Which test should be used: Kruskal-Wallis, Wilcoxon signed-rank, or Spearman correlation? Explain.
- 8
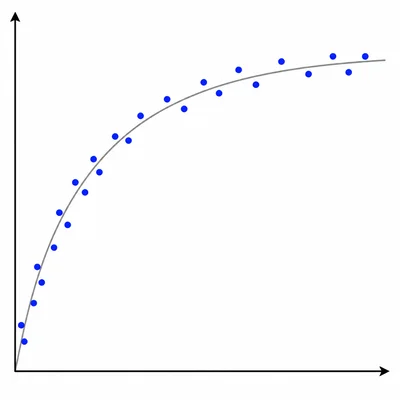
A scatterplot shows that as hours of practice increase, performance score generally increases, but the pattern is curved rather than linear. Which correlation measure is more appropriate: Pearson correlation or Spearman rank correlation? Explain.
- 9
Calculate Spearman's rank correlation for these paired ranks: x ranks are 1, 2, 3, 4, 5 and y ranks are 1, 2, 4, 3, 5. Use rho = 1 - [6 sum d^2]/[n(n^2 - 1)].
- 10
A survey asks people to rate satisfaction as very dissatisfied, dissatisfied, neutral, satisfied, or very satisfied. Why might a non-parametric test be more appropriate than a test that compares means?
- 11
A study reports a Mann-Whitney U test result of p = 0.03 using alpha = 0.05. State the decision and interpret it in context.
- 12
A study reports a Wilcoxon signed-rank test result of p = 0.28 using alpha = 0.05. State the decision and interpret it carefully.
- 13
Observed counts for favorite drink are 18 for water and 12 for juice. If the expected counts are 15 and 15, calculate the chi-square test statistic using sum (O - E)^2/E.
- 14
A Kruskal-Wallis test is used with three groups. The combined ranks give these rank sums: Group A = 3, Group B = 7, Group C = 11. Each group has 2 observations. Which group appears to have the largest typical values, and why?
- 15
For each situation, choose the best non-parametric method from this list: Mann-Whitney U, Wilcoxon signed-rank, Kruskal-Wallis, Spearman rank correlation. Situation 1: compare two independent groups with skewed data. Situation 2: compare before and after scores for the same people. Situation 3: compare four independent groups with ordinal ratings. Situation 4: measure association between two variables with a monotonic but non-linear pattern.