Practice advanced concepts in sampling, including stratified sampling, cluster sampling, systematic sampling, bias, finite population correction, response rates, and sampling distributions.
Read each problem carefully. Show your reasoning, calculations, and conclusions in the space provided.
Designing samples, identifying bias, and analyzing sampling distributions
Statistics - Grade advanced
- 1
A university has 18,000 students: 9,000 undergraduates, 6,000 master's students, and 3,000 doctoral students. A researcher wants a stratified random sample of 600 students proportional to enrollment level. How many students should be sampled from each stratum?
- 2
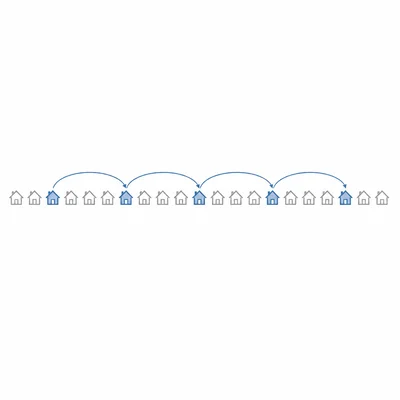
A city planner surveys every 25th household from a randomly chosen starting point on a complete list of households. Identify the sampling method and state one condition needed for it to produce an approximately unbiased sample.
- 3
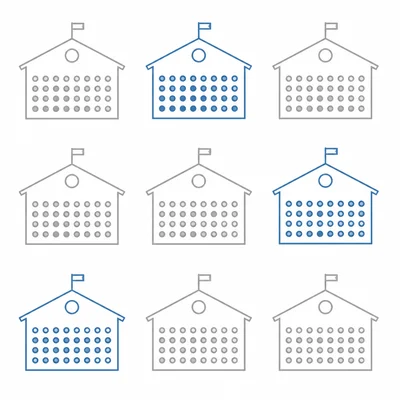
A health agency randomly selects 20 schools from a state and surveys every student in those selected schools. Identify the sampling method. Explain one advantage and one possible disadvantage of this method.
- 4
A pollster uses random digit dialing to estimate voter support for a policy. Only 12 percent of contacted people complete the survey. Name the main type of potential bias and explain why it matters.
- 5
A simple random sample of 400 adults finds that 228 support a new transportation plan. Compute the sample proportion and an approximate standard error for the sample proportion, assuming the population is large.
- 6
A researcher samples 100 people without replacement from a population of 500 and measures a quantitative variable with population standard deviation 12. Compute the standard error of the sample mean using the finite population correction.
- 7
A company wants to estimate average employee satisfaction. It samples 50 employees from each department, even though department sizes are very different. Is this proportional stratified sampling, equal allocation stratified sampling, or cluster sampling? Explain.
- 8
A sample mean from a simple random sample has expected value equal to the population mean. What property does this describe? Explain what it does and does not guarantee.
- 9
A stratified sample is planned for a population with two strata. Stratum A has 1,000 units and standard deviation 20. Stratum B has 4,000 units and standard deviation 5. Explain why Neyman allocation might sample more heavily from Stratum A than proportional allocation would.
- 10
A journalist posts an online poll asking readers whether they support a tax increase. Readers choose whether to participate. Identify the sampling problem and explain the likely consequence.
- 11
A finite population contains 10,000 households. A simple random sample of 1,000 households is selected without replacement. Should the finite population correction be considered? Justify your answer using the sampling fraction.
- 12
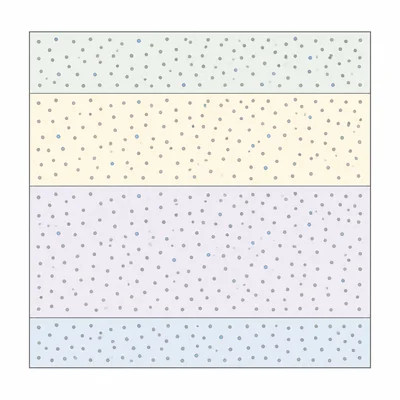
A diagram shows a population divided into four income groups. A fixed percentage is randomly sampled from each income group. What sampling design is shown, and why might it improve precision compared with a simple random sample of the same size?
- 13
A researcher estimates the average commute time using a sample that overrepresents people who live near train stations. Explain how this coverage error could affect the estimate.
- 14
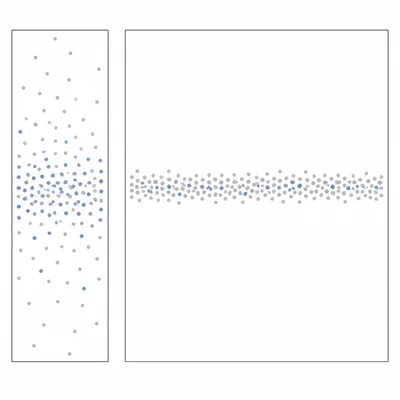
A sampling distribution of a sample proportion is approximately normal with mean 0.40 and standard error 0.03. About what interval would contain roughly 95 percent of sample proportions under repeated sampling? State the rule you used.
- 15
A survey has a frame of 50,000 registered voters, but the target population is all voting-age residents. Explain the difference between the sampling frame and the target population, and name one group likely to be missed.