Sign in to save

Bookmark this page so you can find it later.

Sign in to save

Bookmark this page so you can find it later.

Astronomy high-school May 24, 2026

How Do We Know What Stars Are Made Of?

Starlight carries chemical fingerprints
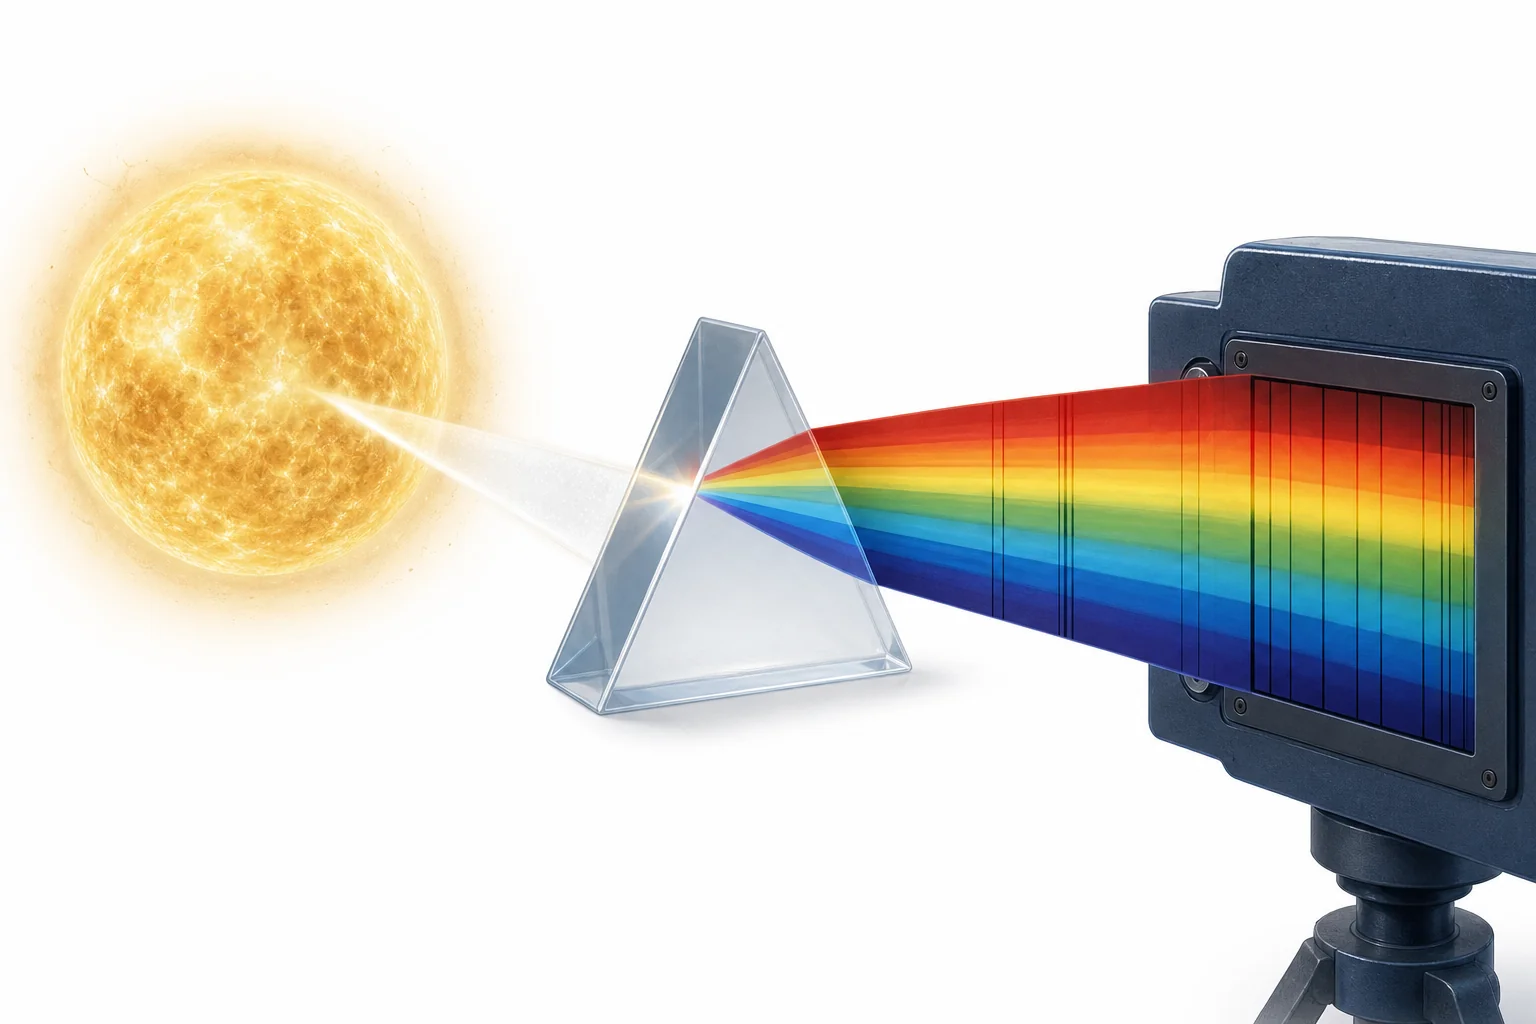
A prism spreads starlight into a spectrum with dark absorption lines that can be compared with element patterns.

Scientists spread starlight into its colors and look for missing lines. Each kind of atom removes its own set of colors from the light. Matching those patterns tells us which elements are in a star.

Big Idea. NGSS HS-ESS1-2 connects the spectra of stars to evidence for their composition, temperature, and motion.

Stars are too far away for a sample jar. The Sun is about 150 million kilometers away, and other stars are much farther. Still, astronomers can study what stars are made of because light carries information. When starlight passes through a prism or a diffraction grating, it spreads into a rainbow called a spectrum. That rainbow is not perfectly smooth. It has thin dark gaps at very specific colors. In the early 1800s, Joseph von Fraunhofer mapped many of these dark gaps in sunlight. Later scientists learned that the gaps come from atoms absorbing certain colors. Hydrogen, helium, sodium, calcium, and iron each leave a different pattern. A star’s spectrum is like a barcode made by atoms. By comparing starlight with spectra measured in a lab, astronomers can identify the elements in a star and learn about its temperature, motion, and history.

A rainbow with gaps
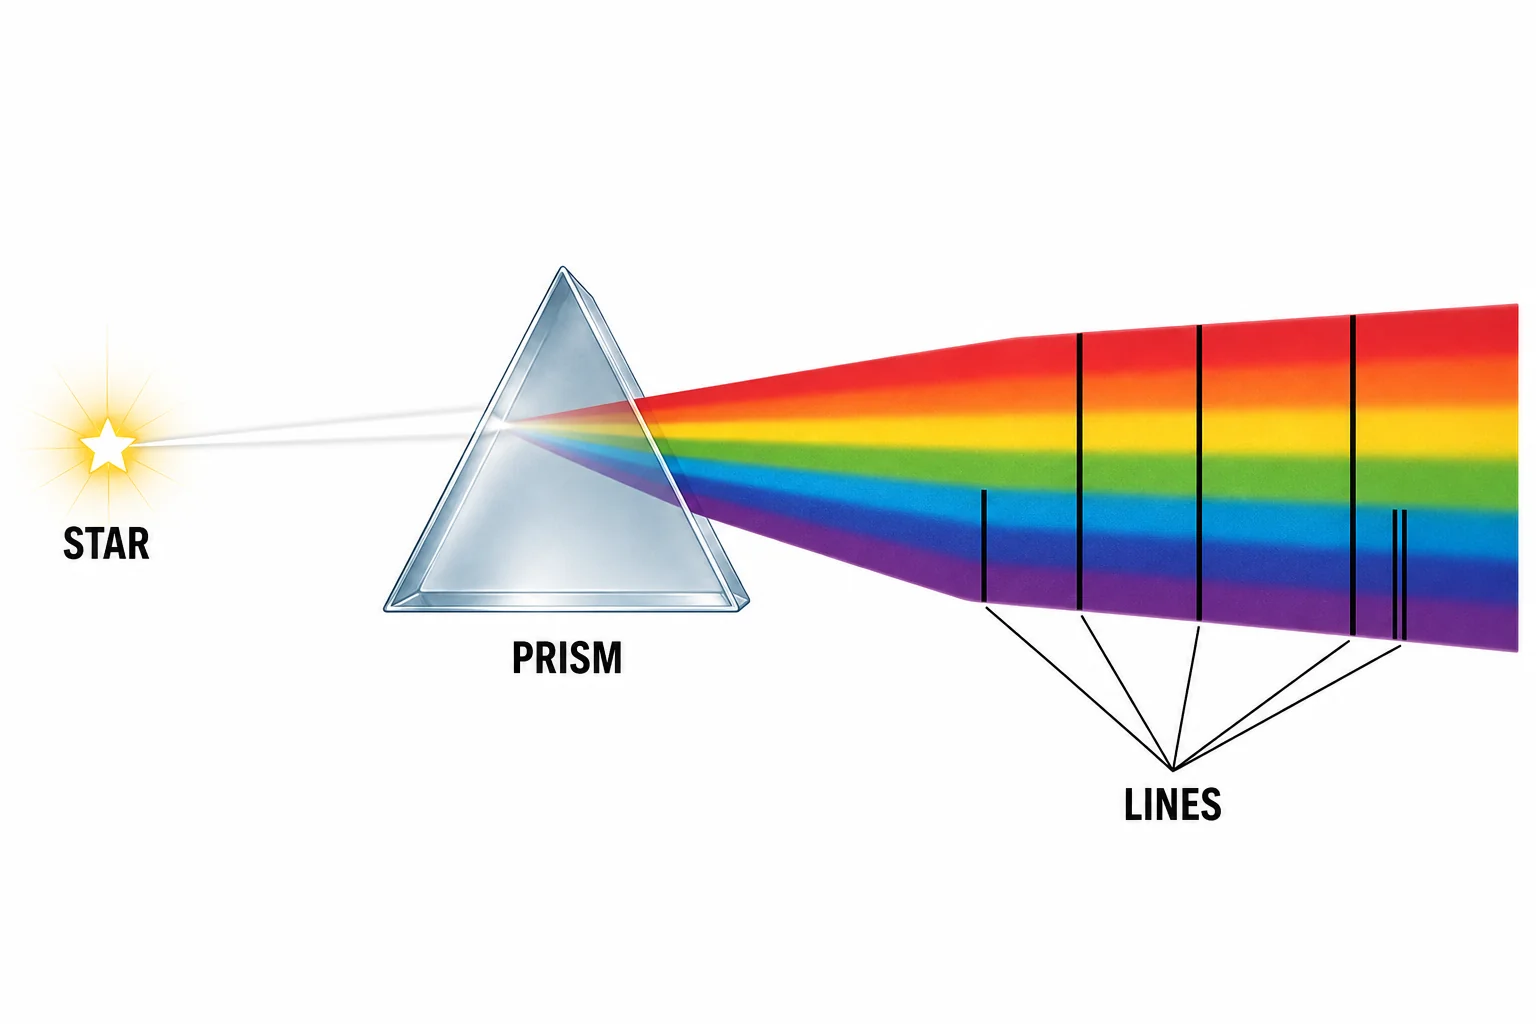
A beam of starlight passes through a prism and spreads into a spectrum with several thin dark absorption lines.
Absorption lines mark missing wavelengths
A spectrum is light sorted by wavelength. White light from a hot, dense object can make a smooth rainbow. Starlight is different because it travels through cooler gas near the star’s surface before it leaves for space. Atoms in that gas absorb only certain wavelengths. Those missing wavelengths appear as thin dark lines in the spectrum. The lines do not happen at random places. They have repeatable positions that can be measured. Fraunhofer lines in the Sun were one of the first clues that sunlight contains hidden chemical information. The dark lines are not tiny cracks in the light. They are evidence that atoms interacted with the light before it reached the telescope. A rainbow becomes a chemistry lesson when scientists measure where the lines are and compare them with known patterns from elements on Earth.

A star’s spectrum is a measured pattern, not just a rainbow.

Atoms choose wavelengths
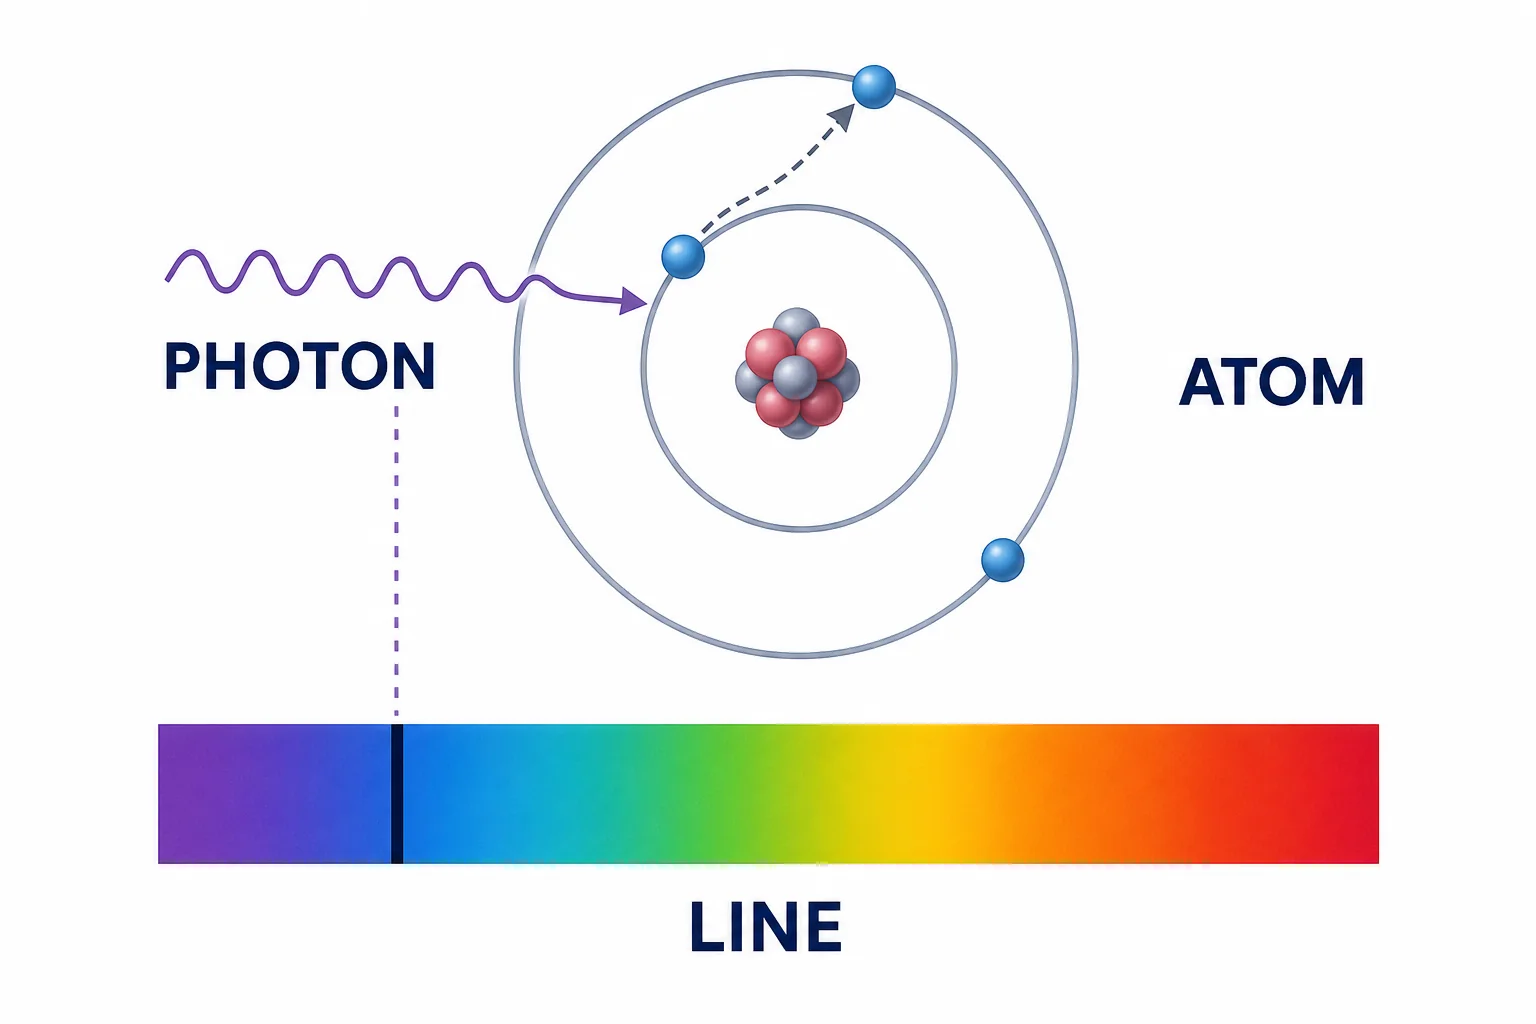
A simple atom absorbs a photon that matches an electron energy jump, with a spectrum line shown below.
Atoms absorb only matching wavelengths
Atoms absorb light in a selective way. Electrons in an atom can only have certain energy amounts. If a photon has just the right energy, an electron can absorb it and move to a higher energy level. If the photon energy does not match an allowed jump, the atom does not absorb it. This rule makes each element absorb a unique set of wavelengths. Hydrogen has one pattern. Sodium has another. Iron has many lines because its atoms have more possible electron jumps. The line pattern depends on the atom’s structure, so it works like a fingerprint. Scientists can create spectra from pure gases in a lab and record the exact wavelengths. Then they compare those lab patterns with starlight. A match means that element is present in the cooler gas that shaped the star’s light.

Line positions come from the energy structure of atoms.

Matching the pattern
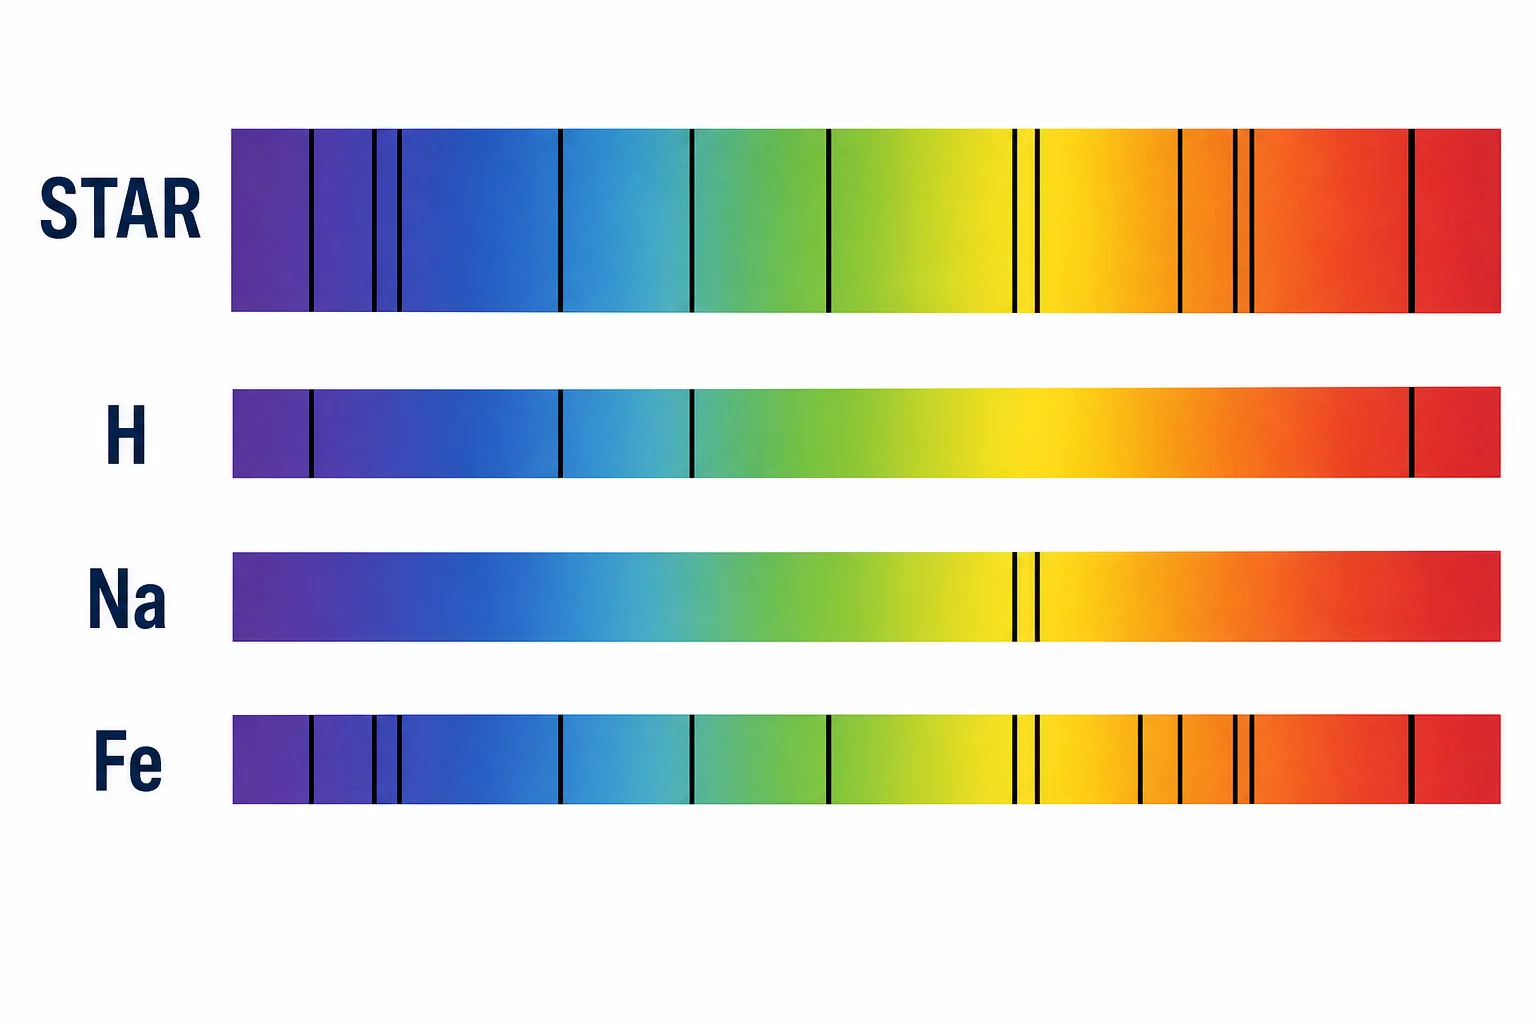
A star spectrum is compared with reference line patterns for hydrogen, sodium, and iron.
Scientists match many lines at once
Astronomers do not identify a star from one line alone. A single dark line can be misleading because different elements can have lines near the same wavelength. Instead, scientists look for a group of lines that match a known element. The spacing matters. The relative strength of the lines matters too. A spectrum from a star is compared with reference spectra measured on Earth. If the hydrogen lines line up, hydrogen is present. If sodium’s yellow pair appears, sodium may be present. If many iron lines match, iron is in the star’s atmosphere. Modern software can test many elements at once, but the basic idea is the same as Fraunhofer’s careful maps. The evidence is strongest when several lines from the same element appear at the right wavelengths in the same spectrum.

A reliable match uses a set of lines, not a single mark.

Temperature changes line strength
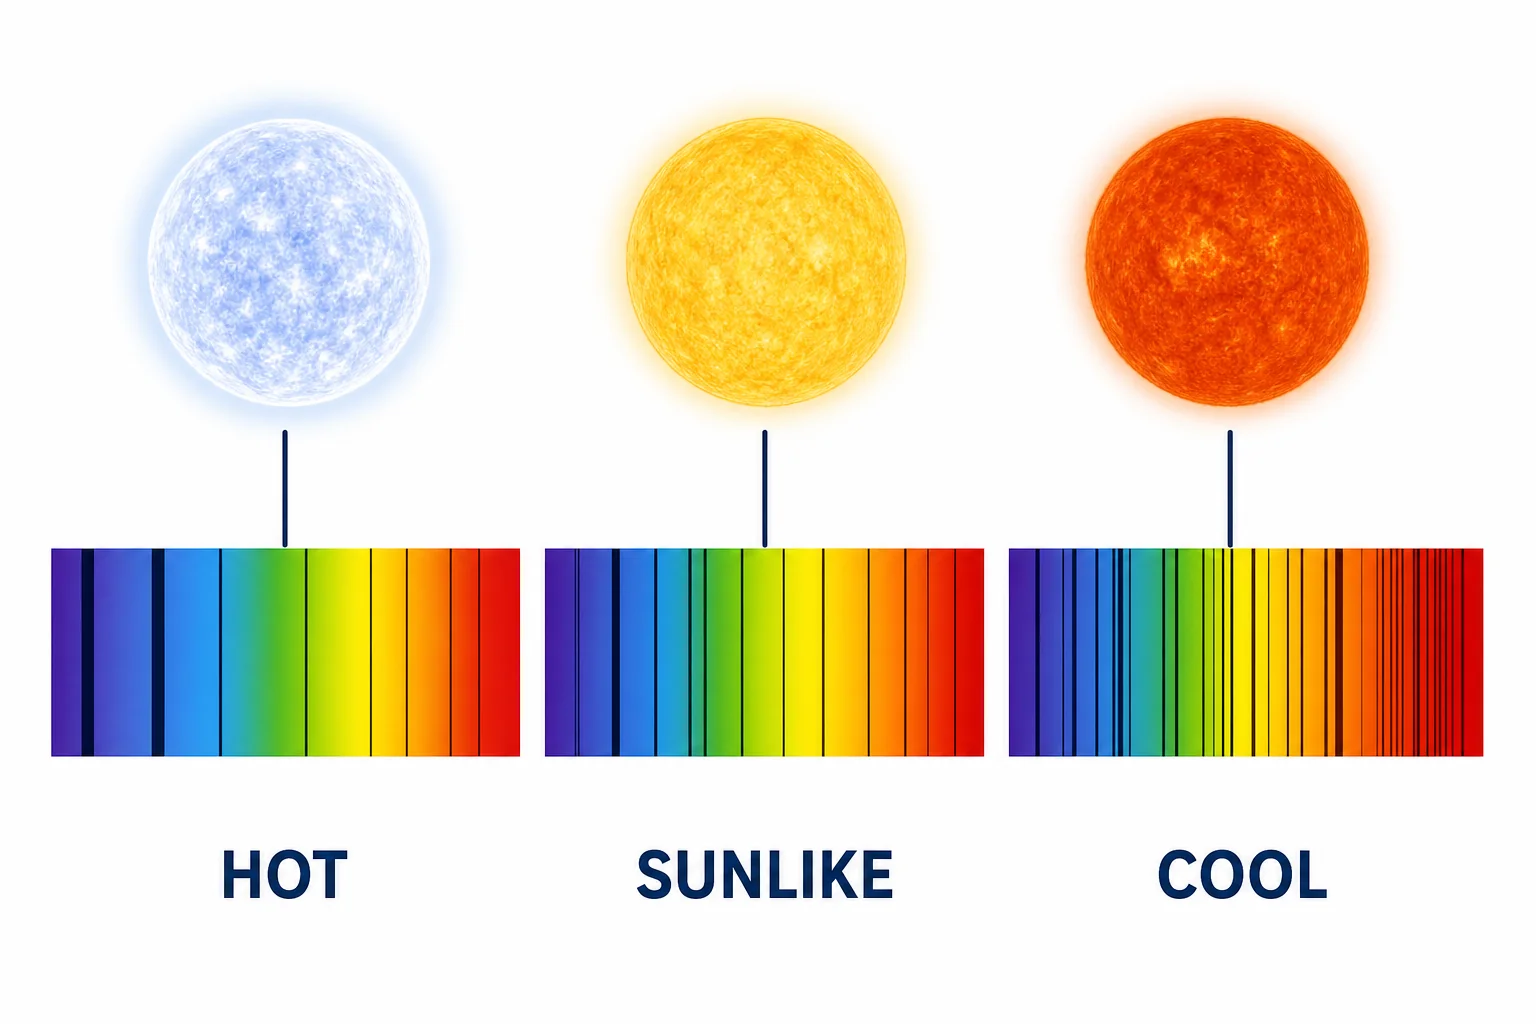
Three stars of different temperatures show spectra with different absorption line strengths.
Temperature affects which lines stand out
A star’s spectrum also depends on temperature. Hotter stars and cooler stars can contain the same element but show different line strengths. Temperature affects how many atoms are in the right state to absorb a certain wavelength. If a gas is too cool, many electrons stay in low energy states and some lines may be weak. If it is too hot, atoms can lose electrons, and lines from neutral atoms may fade. This is why the strength of a line is not a simple measure of how much of an element is present. Astronomers use models that include temperature, pressure, and ionization. A blue-white star may show strong hydrogen lines. A cooler orange star may show stronger metal lines. Composition and temperature must be interpreted together.

Line strength depends on both chemistry and temperature.

Moving stars shift lines
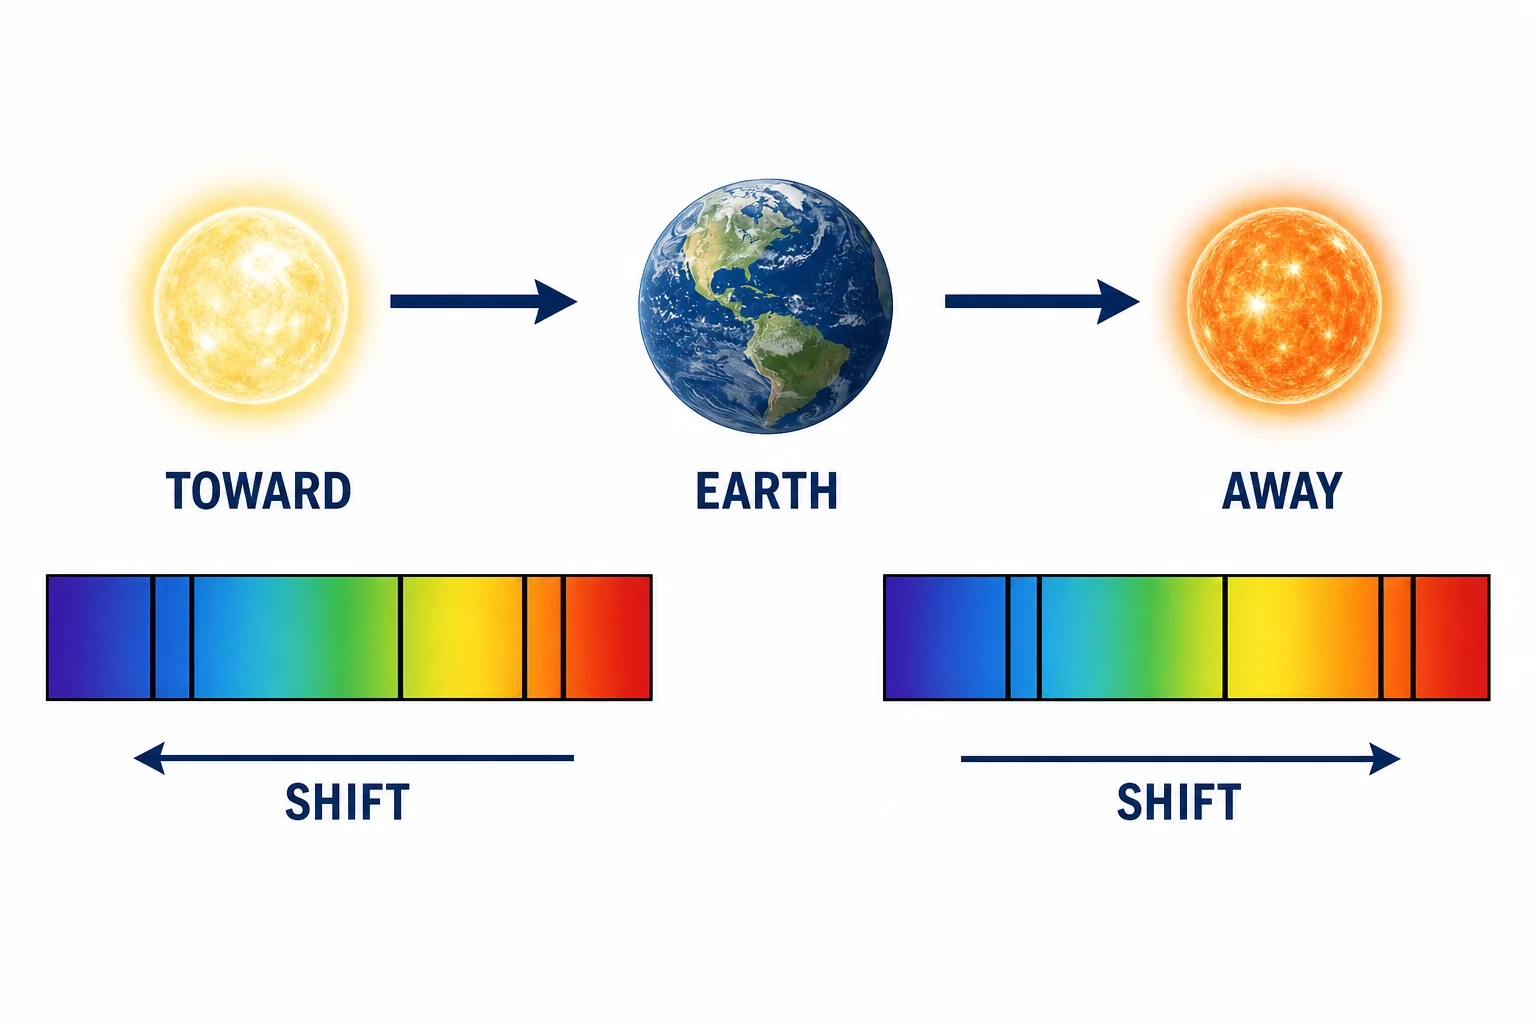
Two spectra show the same absorption line pattern shifted toward blue for an approaching star and toward red for a receding star.
Motion shifts the whole line pattern
Spectral lines can move slightly from their normal positions. This happens when a star moves toward or away from Earth. If a star moves toward us, its wavelengths are compressed a little and its lines shift toward the blue end of the spectrum. If it moves away, wavelengths stretch and lines shift toward the red end. This is called the Doppler effect. The pattern of lines still identifies the elements, but the whole pattern is displaced. Astronomers correct for this shift before measuring composition. The same shift also helps measure a star’s radial velocity. In binary star systems, lines can move back and forth as stars orbit each other. A spectrum can therefore reveal both what a star is made of and how it is moving through space.

The same lines can show chemistry and motion.

Vocabulary

Spectrum
Light spread out by wavelength, often seen as a band of colors.
Absorption line
A dark line in a spectrum where atoms absorbed a specific wavelength of light.
Fraunhofer lines
Dark absorption lines in the Sun’s spectrum first mapped carefully by Joseph von Fraunhofer.
Wavelength
The distance from one wave peak to the next, which relates to the color of visible light.
Doppler effect
A change in observed wavelength caused by motion toward or away from the observer.
Ionization
The process in which an atom loses or gains electrons and becomes charged.

In the Classroom

Make a classroom spectroscope

35 minutes | Grades 9-12

Students use a cardboard tube, a narrow slit, and a diffraction grating to view spectra from safe classroom light sources. They sketch the spectra and compare continuous, bright-line, and absorption-like patterns.

Match mystery star spectra

25 minutes | Grades 9-12

Give students printed spectra for several elements and a mystery star spectrum. Students identify which elements are present by lining up several matching absorption lines.

Model Doppler shifts with line cards

20 minutes | Grades 9-12

Students slide a transparent line pattern over a printed spectrum to model redshift and blueshift. They explain why the spacing stays the same even when the whole pattern shifts.

Key Takeaways

  • Stars reveal their composition through the light they send to Earth.
  • A spectrum spreads starlight by wavelength and shows dark absorption lines.
  • Each element absorbs a unique pattern of wavelengths.
  • Astronomers compare star spectra with laboratory spectra to identify elements.
  • Temperature and motion affect spectra, so scientists account for both when reading starlight.