Understanding Air Pressure and Weather Instruments Lab
Air pressure comes from gas molecules colliding with surfaces. This lab connects that microscopic idea with two visible comparisons, the change in atmospheric pressure with altitude and the change in pressure inside a sealed container when its temperature changes.
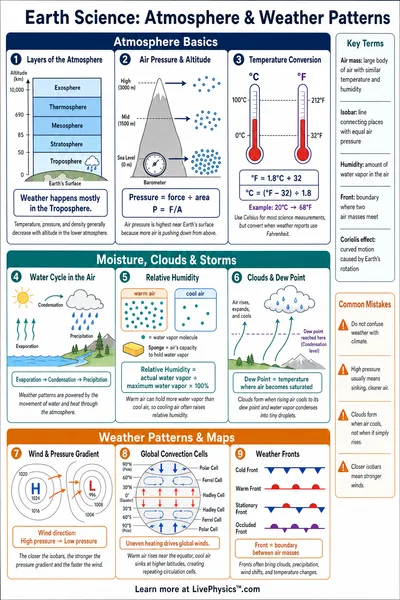
A barometer measures the surrounding atmospheric pressure. The lab displays pressure using familiar weather units, but the reading at a mountain location should not be confused with a weather report that has been adjusted to sea level.
Atmospheric pressure generally decreases as altitude increases. Higher locations have less air above them, and the remaining atmosphere supplies less weight per unit area to the column beneath it.
The model uses an idealized atmosphere at one constant temperature. Its exponential pressure decrease is useful for studying the relationship with height, while real atmospheric temperature profiles and changing weather produce departures from this simplified picture.
Change altitude while holding the atmospheric temperature fixed. Compare the pressure readings and the position on the graph, then record values from several heights rather than drawing a conclusion from just one pair of locations.
Temperature changes the density and vertical distribution of an ideal gas atmosphere. In this model the sea-level reference pressure remains fixed, so adjusting temperature explores a specific mathematical comparison rather than reproducing every process in a real warm or cold weather system.
The container comparison holds the amount of trapped gas and the container's volume fixed. Heating makes the gas exert more pressure on the walls, while cooling lowers its pressure under those same fixed conditions.
Absolute temperature is essential to this relationship. Doubling a Celsius reading does not double gas pressure, because the proportional relationship uses kelvin, whose zero corresponds to absolute zero rather than the freezing point of water.
Compare the pressure inside the container with the surrounding pressure. A larger internal pressure produces an outward imbalance, while a smaller internal pressure allows the surrounding air to exert the greater inward push on the walls.
The container illustration shows the direction of that imbalance conceptually. Actual buckling depends on the wall material, thickness, shape, and defects, so the drawing is not a calculation of when a particular container would collapse.
A familiar steam-can demonstration involves another process beyond simply cooling trapped air. Water vapor condenses and reduces the amount of gas in the can, so a fixed-amount ideal gas model cannot reproduce that full experiment by changing temperature alone.
Use the data table to support separate claims about altitude and container temperature. State which conditions stayed fixed, distinguish internal pressure from atmospheric pressure, and identify one assumption that would need changing before using the model to interpret a real weather station or a deforming container.