Logistic Regression Classifier Lab
Place points for two classes, then train a logistic regression classifier and watch the straight decision boundary rotate into place as the cross-entropy loss drops and accuracy climbs. Compare separable, overlapping, diagonal, and XOR data to see where a single linear boundary works and where it fails.
Guided ExperimentTrain a classifier on separable data
If two classes form two clearly separated clusters, do you expect logistic regression to classify every point correctly? Predict what the decision boundary will look like.
Write your hypothesis in the Lab Report panel, then click Next.
Classifier Plot
Click empty space to add a point of the selected brush class. Drag a point to move it. Shift+click a point to remove it.
Training Metrics
- The boundary is a straight line because logistic regression is a linear classifier.
- Press Run Experiment to train and watch the boundary move.
Controls
Data Table
(0 rows)| # | Dataset | Learning rate | Epochs | Final loss | Accuracy |
|---|
Reference Guide
What Logistic Regression Does
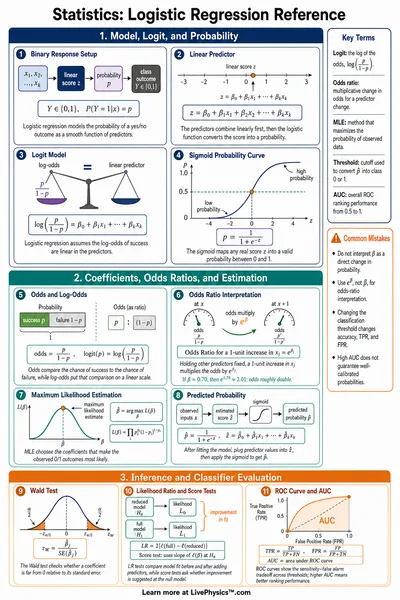
Logistic regression turns a linear score into a probability using the sigmoid function. The score is a weighted sum of the features.
A point is assigned to Class B when the predicted probability is at least 0.5, and to Class A otherwise.
The Decision Boundary Is a Line
The 0.5 threshold happens exactly where the linear score equals zero. In two dimensions that set is a straight line.
Because the boundary is always linear, logistic regression can only split data that two regions of one straight line can separate.
Cross-Entropy Loss and Gradient Descent
Training minimizes the mean binary cross-entropy, which is small when correct points get high probability.
Each epoch moves the weights a small step against the gradient. The learning rate sets the step size, so a larger rate converges faster but can overshoot.
Linear Separability and the XOR Limit
Data is linearly separable when one straight line can put every point of each class on its own side.
- Separable clusters reach 100 percent accuracy.
- Overlapping classes leave some points misclassified.
- XOR places each class in two opposite corners, so no single line can separate it and accuracy stalls near 50 percent.
Solving XOR needs a nonlinear model such as a neural network with a hidden layer.