Practice calculating residuals, interpreting residual plots, and checking the conditions for using linear regression.
Read each problem carefully. Show your work and explain your reasoning in complete sentences when asked.
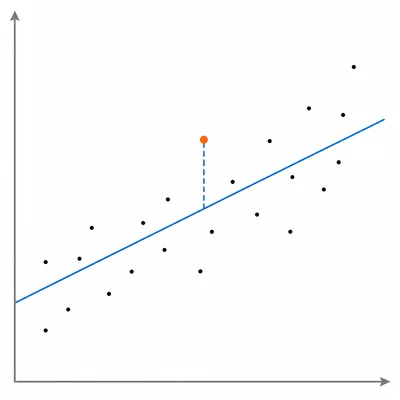
Using residuals to check whether a linear regression model is appropriate
Statistics - Grade 9-12
- 1
A regression model predicts a student's test score using hours studied: predicted score = 52 + 7.5(hours studied). A student studied for 4 hours and earned an actual score of 86. Calculate the residual and explain what it means.
- 2
A regression model predicts the cost of a used car from its age. One car has an actual price of $9,800 and a predicted price of $10,600. Find the residual and interpret it in context.
- 3
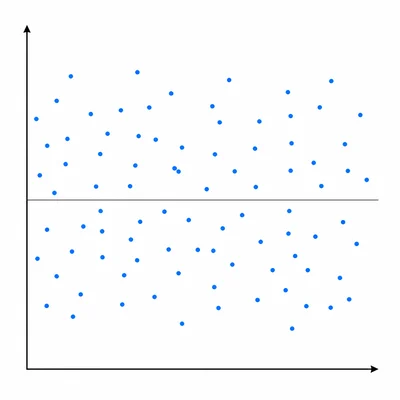
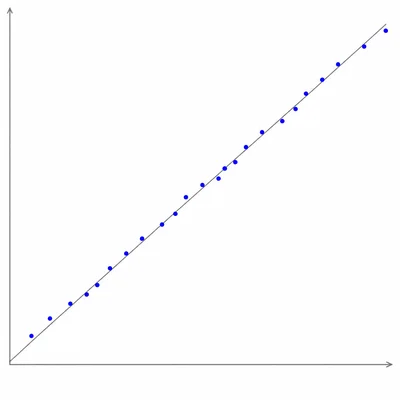
A residual plot shows residuals scattered randomly around 0 with no clear pattern and roughly the same vertical spread across all x-values. What does this suggest about the linear regression model?
- 4
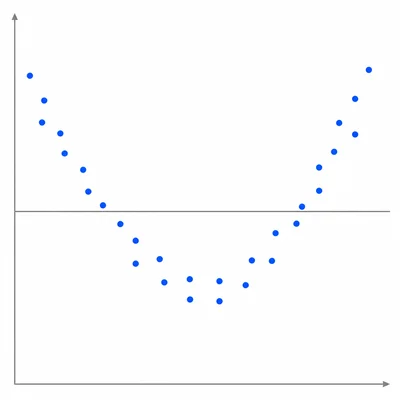
A residual plot forms a clear U-shape, with positive residuals for small and large x-values and negative residuals for middle x-values. What condition appears to be violated, and what should the analyst consider?
- 5
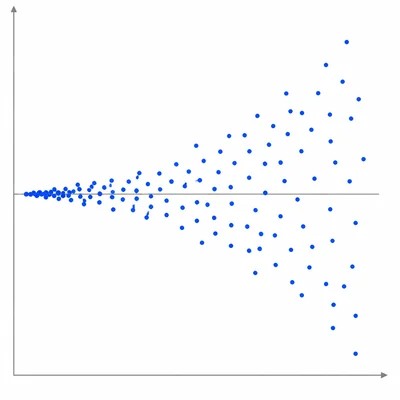
In a regression analysis, residuals become more spread out as x increases. Name the condition that is not met and explain why it matters.
- 6
List the four common conditions checked before using a linear regression model for inference.
- 7
A class fits a regression line to predict backpack weight from student height. The residual plot shows no pattern, but the data were collected by measuring 30 students from the same sports team after practice. Which condition might be a concern, and why?
- 8
A normal probability plot of the residuals is nearly straight, with only small random deviations. What does this suggest about the normal residuals condition?
- 9
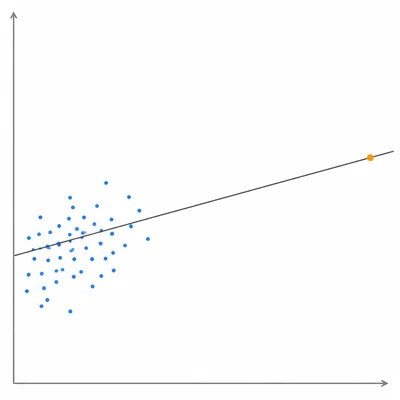
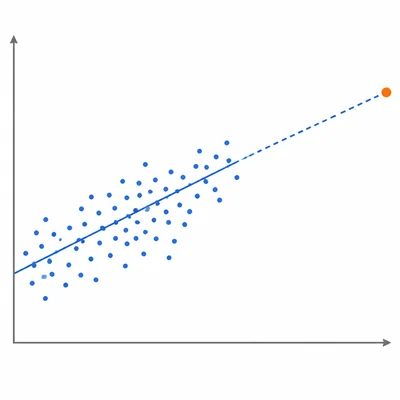
A scatterplot contains one point with an x-value much larger than all the other x-values. The point lies close to the regression line. Explain why this point may still be important in regression diagnostics.
- 10
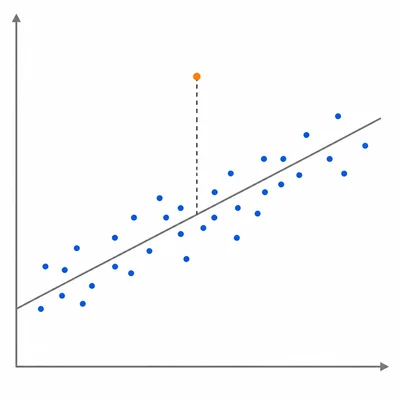
A data point has a large residual but an x-value near the center of the data. Is it more accurate to call it an outlier, a high-leverage point, or both? Explain.
- 11
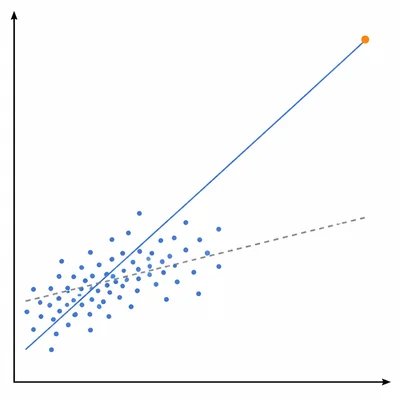
A point has a very unusual x-value and removing it changes the regression slope from 1.2 to 2.8. What type of point is this, and why?
- 12
A regression model predicts monthly electricity cost from average outdoor temperature. The residuals for 12 months are measured in dollars: -5, 7, -3, 4, 0, -6, 8, -2, 5, -4, 3, -7. Are the residuals centered around 0? Explain using the sum or mean of the residuals.
- 13
A regression model has residual standard deviation s = 3.2 minutes when predicting race time. Interpret this value in context.
- 14
A student says, "The correlation is strong, so we do not need to check the residual plot." Explain why this statement is incorrect.
- 15
A regression model was created using data from houses between 800 and 3,000 square feet. A real estate agent uses the model to predict the price of a 5,200-square-foot house. Identify the diagnostic or modeling concern and explain the risk.