Margin of Error & Poll Interpretation Lab
Draw samples from a population with a known true proportion and watch the margin of error narrow as the sample size grows. Then practice reading real poll scenarios to decide when a reported lead is meaningful and when it is just a statistical tie.
Guided Experiment Watch the Margin of Error Shrink
Hypothesis
Setup
Run Experiment
Analyze
Conclude
Do you predict a bigger or smaller sample will give a poll estimate closer to the true population proportion?
Write your hypothesis in the Lab Report panel, then click Next.
Controls
Draw a Sample
Estimate vs. True Proportion
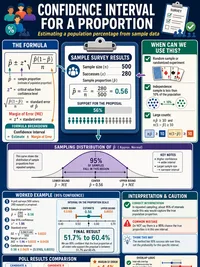
Sample estimate 61.4% ± 4.3 points (95% confidence interval 57.1% to 65.7%)
The shaded band is the estimate's margin of error. Increase the sample size to watch it narrow.
0 / 500
0 / 500
0 / 500
Reference Guide
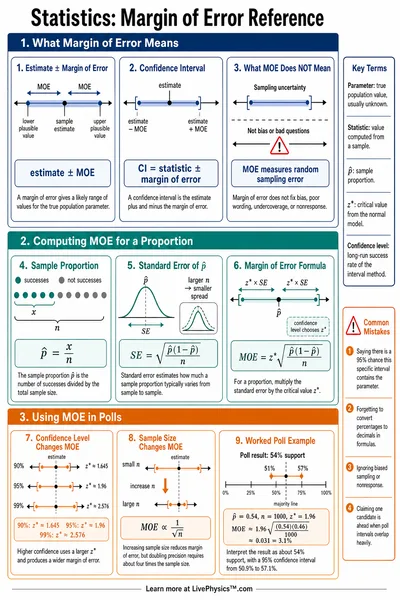
What Margin of Error Means
- It is a range, not a guarantee. A margin of error of plus or minus 3 points means the true value is very likely within 3 points of the reported number.
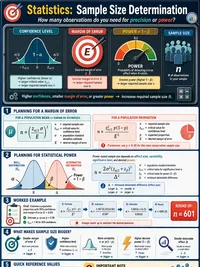
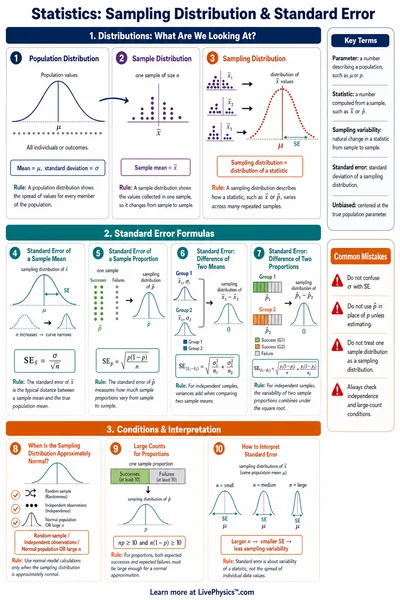
- Bigger samples narrow the range. Margin of error shrinks as sample size grows, roughly by one over the square root of n.
- A lead inside the margin is a tie. If two candidates are closer together than twice the margin of error, the race is a statistical tie.
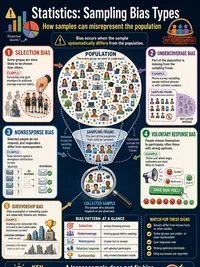
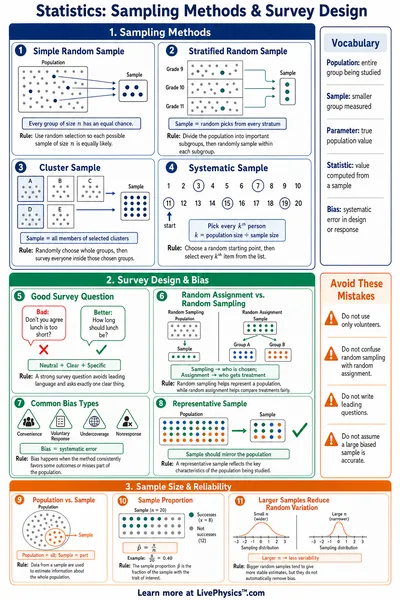
- It does not fix a biased sample. Margin of error only measures random sampling variation. It says nothing about whether the people surveyed represent the full population.
How to Use This Lab
- In the Sampler panel, set a true proportion and a sample size, then resample to see the estimate change.
- Increase the sample size and watch the margin of error, and the shaded interval, narrow.
- Switch to Poll Cards to read a reported poll result and answer the interpretation question.
- Reveal each card to check your answer and read the explanation.
Related Content
Related Tools
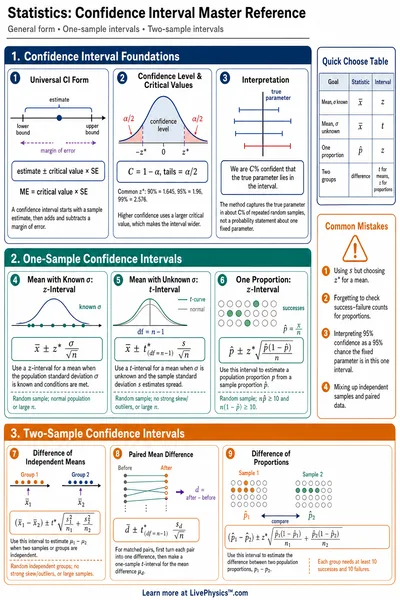
Confidence Interval Calculator
Calculate confidence intervals for means (z and t) and proportions. See margin of error, critical values, number line visualization, and sample size calculations.
Sampling Distribution Visualizer
Pick a population distribution and watch the Central Limit Theorem in action. Draw random samples, plot the means, and see how the sampling distribution becomes normal regardless of population shape.
Central Limit Theorem Simulator
Draw repeated samples from non-normal populations and watch the sampling distribution become normal. Side-by-side histograms.
Power & Sample Size Planner
Plan a study by balancing effect size, sample size, significance level, and power. See the null and alternative distributions, the Type I and Type II error regions, and the power curve, then read the sample size you need.
Related Labs
Scientific Data Graphing Lab
General purpose data analysis lab. Paste a CSV, upload a file, or load a sample. Choose X and Y columns and fit a linear, quadratic, cubic, power, exponential, or logarithmic curve. Auto best fit picker, R squared, residuals, and shareable URL.
Graphs for Kids Lab
Build bar graphs from category data, read which groups have the most and fewest, compute the difference, and record findings to practice data literacy skills.
Mean, Median & Mode Lab
Enter number datasets, compute mean, median, mode, and range instantly, and record multiple datasets to discover when each measure of center best represents the data.
Hypothesis Testing Lab
Set up a one-sample z-test. Enter population mean, sample mean, standard deviation, and sample size. Compute the z-statistic, p-value, and decision to reject or fail to reject the null hypothesis.