Understanding Ocean Currents Explorer
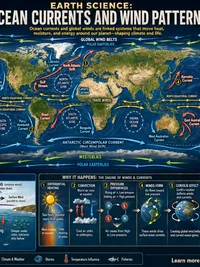
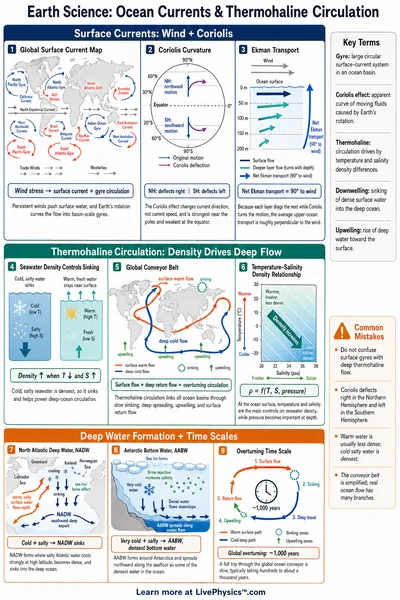
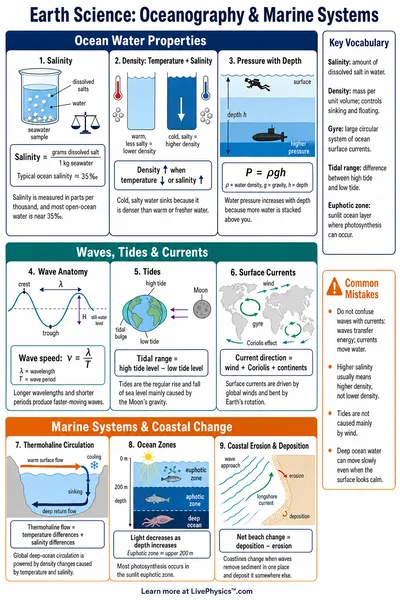
Most large surface currents begin with wind pushing across the sea surface. Earth’s rotation bends this moving water through the Coriolis effect, sending flow to the right in the Northern Hemisphere and to the left in the Southern Hemisphere. Continents block the paths, so water turns and forms broad circular systems called gyres.
The flow is not equally strong everywhere. Narrow western boundary currents, such as the Gulf Stream, can be fast because water becomes concentrated along a continental edge. Friction, changing winds, and the shape of the seafloor all affect the route.
Currents move heat from low latitudes toward higher latitudes. This transfer helps explain why some coastal places are milder or cooler than other places at the same latitude. A warm current can add moisture to air above it, which may increase rain on nearby land.
A cold current can cool the air and reduce evaporation, contributing to dry coastal climates or frequent fog. Cold currents often cause upwelling when winds move surface water away from shore. Deeper water rises to replace it, bringing nutrients that support plankton, fish, seabirds, and fishing communities.
Deep ocean circulation works differently from wind-driven flow. Water becomes denser when it cools or when evaporation leaves more salt behind. Dense water can sink in a few very cold regions, then spread slowly through deep ocean basins.
This process is part of thermohaline circulation, where thermal means temperature and haline means salt. It is sometimes called a global conveyor belt, but that image can be misleading because the water follows many branching paths and moves very slowly. A complete trip through this system can take hundreds or even thousands of years.
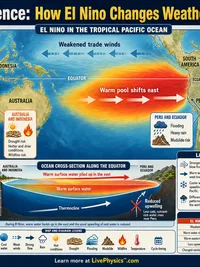
When studying a current map, pay attention to direction, location, and whether the water is relatively warm or cold. Do not assume a current has one fixed speed or boundary, since seasons, storms, and climate patterns can shift it. Compare currents on opposite sides of an ocean basin to see how their effects differ.
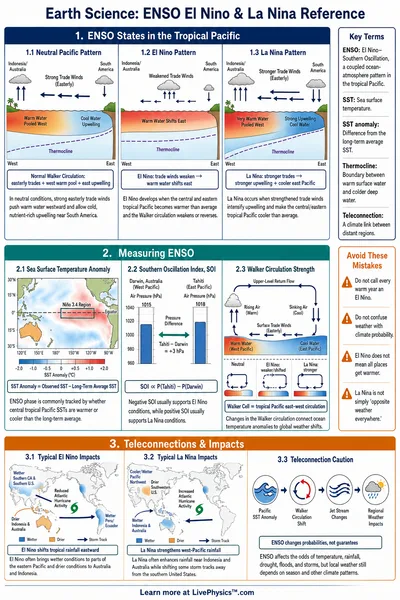
These patterns matter beyond classwork. They influence weather forecasts, shipping routes, marine ecosystems, pollution movement, and the spread of floating plastic. As the climate warms, changes in wind, ice melt, rainfall, and ocean temperature may alter circulation, with effects that can reach far from the water itself.