Practice reading line graphs, comparing values, finding changes over time, and describing trends.
Read each problem carefully. Use the data or graph description to answer each question. Show your work in the space provided.
Practice reading values, changes, and patterns on line graphs
Math - Grade 4-5
- 1
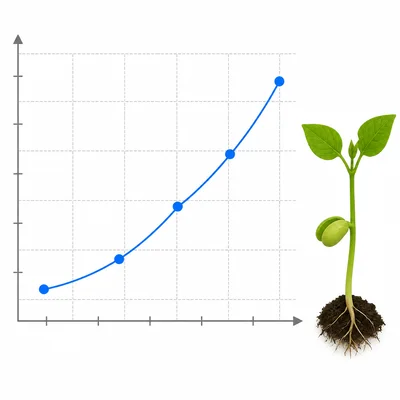
A line graph shows the height of a bean plant over 4 weeks. The points are Week 0: 2 cm, Week 1: 4 cm, Week 2: 7 cm, Week 3: 9 cm, and Week 4: 12 cm. How tall was the plant at Week 3?
- 2
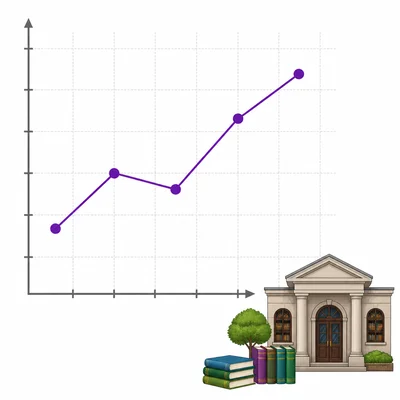
A line graph shows library visitors from Monday to Friday. The values are Monday: 20, Tuesday: 35, Wednesday: 30, Thursday: 45, and Friday: 50. Describe the overall trend.
- 3
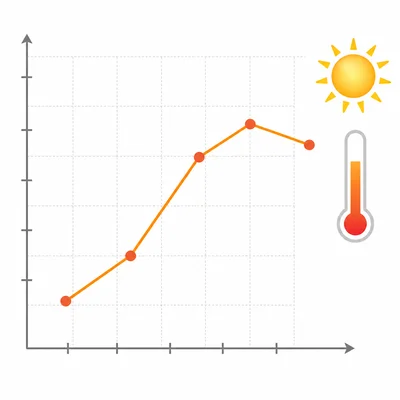
A line graph shows the temperature during the day. The values are 8 a.m.: 60°F, 10 a.m.: 65°F, 12 p.m.: 72°F, 2 p.m.: 76°F, and 4 p.m.: 74°F. During which time interval did the temperature increase the most?
- 4
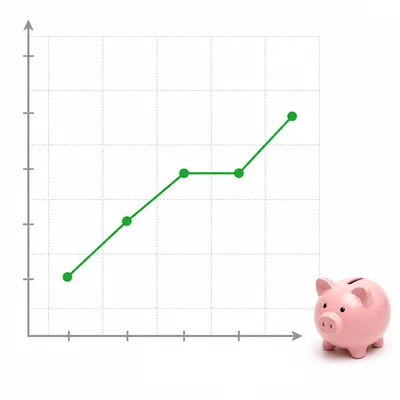
A savings line graph shows January: $15, February: $25, March: $40, April: $40, and May: $55. Between which two months did the savings stay the same?
- 5
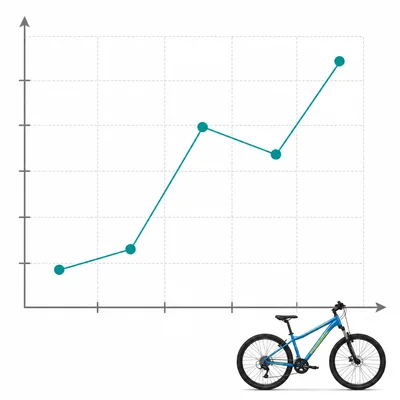
A line graph shows the number of miles Mia biked each day. The values are Monday: 2 miles, Tuesday: 3 miles, Wednesday: 5 miles, Thursday: 4 miles, and Friday: 6 miles. How many more miles did she bike on Friday than on Monday?
- 6
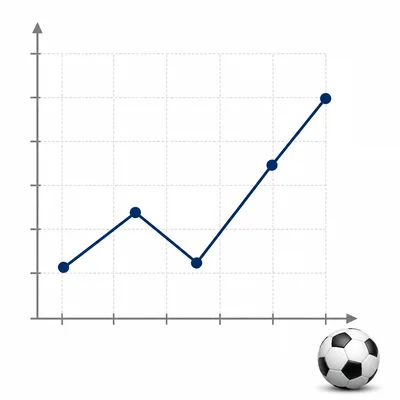
A line graph shows a team's points over five games. The values are Game 1: 12 points, Game 2: 18 points, Game 3: 15 points, Game 4: 20 points, and Game 5: 24 points. How many points did the team score in Game 3, and how did that compare to Game 2?
- 7
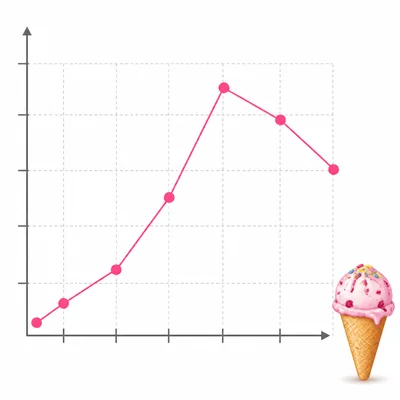
A line graph shows ice cream cones sold each hour. The values are 10 a.m.: 5 cones, 11 a.m.: 9 cones, 12 p.m.: 15 cones, 1 p.m.: 22 cones, 2 p.m.: 20 cones, and 3 p.m.: 18 cones. At what time were the most cones sold, and what happened after that time?
- 8
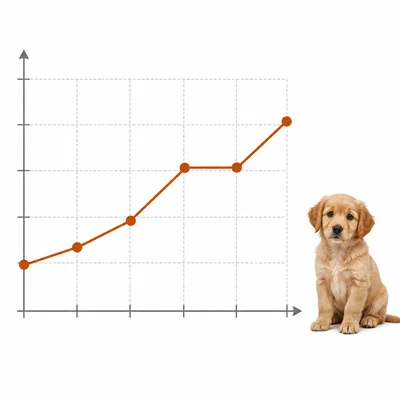
A line graph shows a puppy's weight over 6 months. The values are Month 1: 6 pounds, Month 2: 8 pounds, Month 3: 10 pounds, Month 4: 13 pounds, Month 5: 13 pounds, and Month 6: 15 pounds. Between which two months did the puppy gain the most weight?
- 9
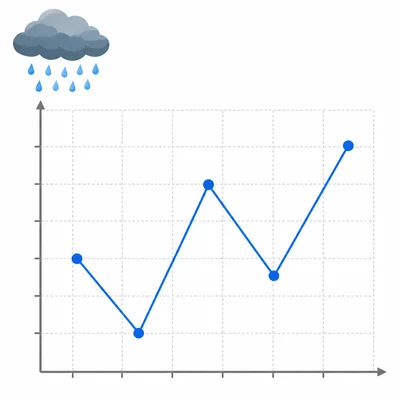
A line graph shows rainfall over five weeks. The values are Week 1: 3 cm, Week 2: 1 cm, Week 3: 4 cm, Week 4: 2 cm, and Week 5: 5 cm. Which week had the lowest rainfall, and which week had the highest rainfall?
- 10
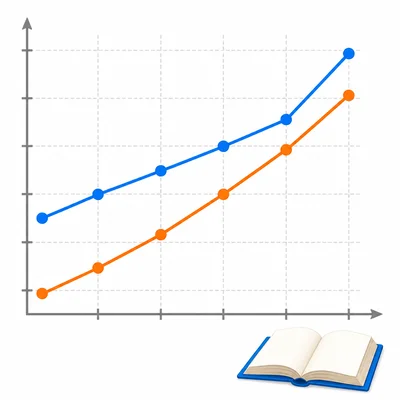
A double line graph shows pages read by Ana and Ben from Monday to Friday. Ana read 10, 15, 20, 22, and 25 pages. Ben read 12, 14, 16, 21, and 27 pages. Who read more pages on Friday, and by how many pages?
- 11
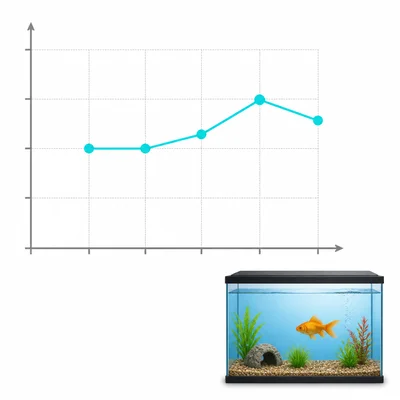
A line graph shows aquarium water temperature. The values are Monday: 70°F, Tuesday: 70°F, Wednesday: 71°F, Thursday: 73°F, and Friday: 72°F. What does the flat part from Monday to Tuesday show?
- 12
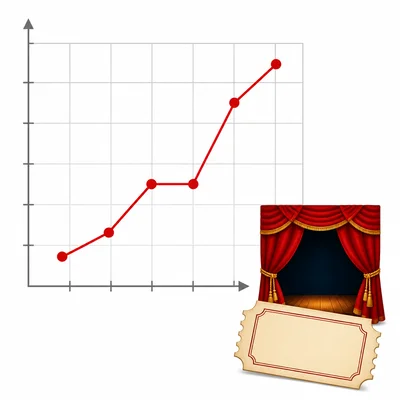
A line graph shows tickets sold during the first 6 days of a school play sale. The values are Day 1: 25, Day 2: 30, Day 3: 45, Day 4: 45, Day 5: 60, and Day 6: 80. How many more tickets were sold by Day 6 than by Day 4?
- 13
A line graph connects the point 1 p.m.: 8 liters to the point 2 p.m.: 12 liters with a straight line. Estimate the amount at 1:30 p.m.
- 14
A line graph shows steps walked during a school week. The values are Monday: 3,000 steps, Tuesday: 4,500 steps, Wednesday: 4,000 steps, Thursday: 6,000 steps, and Friday: 7,000 steps. Between which two days did the number of steps decrease?
- 15
A line graph would show cafeteria milk sales for the week as Monday: 80 cartons, Tuesday: 75 cartons, Wednesday: 70 cartons, Thursday: 78 cartons, and Friday: 85 cartons. Describe the trend from Monday to Wednesday, then from Wednesday to Friday.