Practice reading and interpreting position-time and velocity-time graphs for one-dimensional motion.
Read each problem carefully. Use correct units in every numerical answer. Show your work in the space provided.
Interpreting slope, area, displacement, and acceleration
Physics - Grade 9-12
- 1
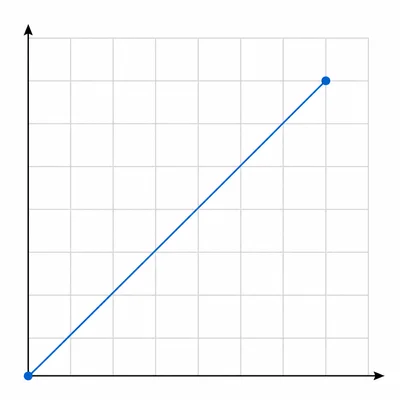
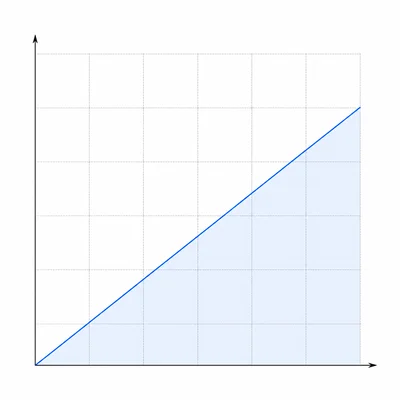
A position-time graph shows a straight line from position 0 m at time 0 s to position 20 m at time 4 s. Find the object's velocity.
- 2
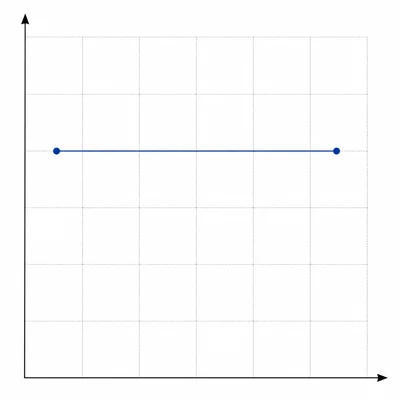
A position-time graph is a horizontal line at 12 m from 0 s to 5 s. Describe the object's motion and find its velocity.
- 3
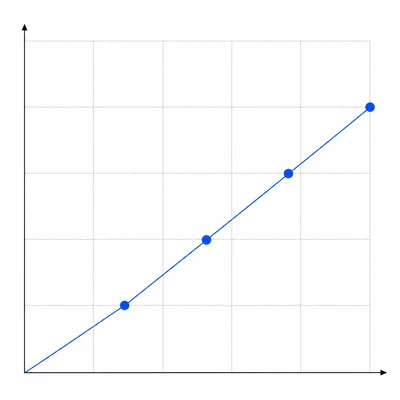
A position-time graph has points (0 s, 0 m), (2 s, 6 m), (4 s, 12 m), and (6 s, 18 m). Describe the motion and calculate the velocity.
- 4
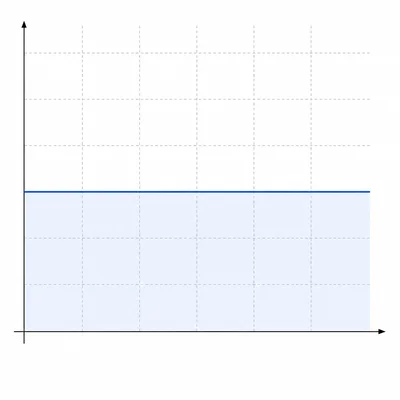
A velocity-time graph shows a constant velocity of 3 m/s from 0 s to 8 s. Find the displacement during this time interval.
- 5
A velocity-time graph starts at 0 m/s at 0 s and increases in a straight line to 20 m/s at 5 s. Find the acceleration and the displacement from 0 s to 5 s.
- 6
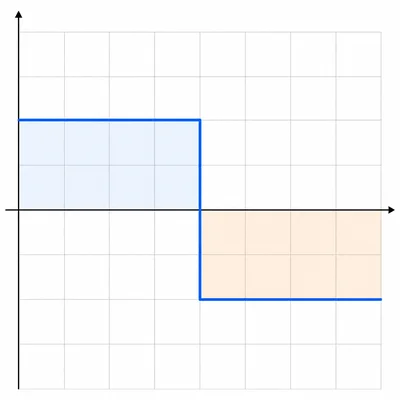
A velocity-time graph shows +6 m/s from 0 s to 4 s, then -2 m/s from 4 s to 7 s. Find the total displacement and the total distance traveled.
- 7
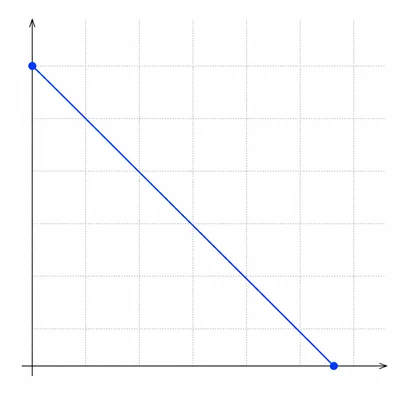
A position-time graph decreases in a straight line from 30 m at 0 s to 0 m at 6 s. Find the velocity and explain the sign of your answer.
- 8
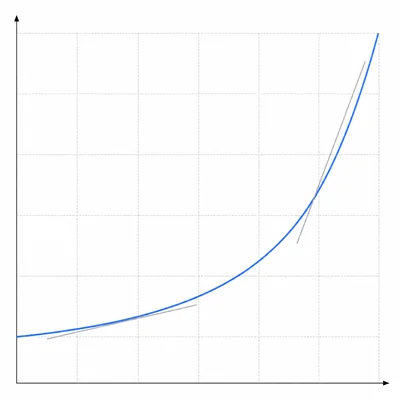
A curved position-time graph gets steeper as time increases, and the curve bends upward. Describe what is happening to the object's velocity.
- 9
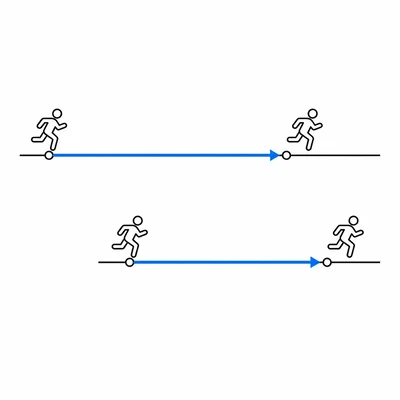
Runner A's position changes from 0 m to 40 m in 10 s. Runner B's position changes from 10 m to 50 m in 10 s. Compare their velocities.
- 10
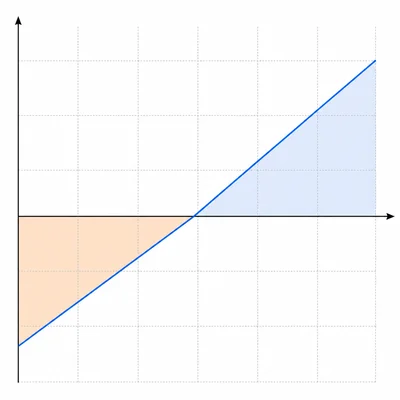
A velocity-time graph is a straight line from -4 m/s at 0 s to +4 m/s at 4 s. Find the acceleration and the total displacement from 0 s to 4 s.
- 11
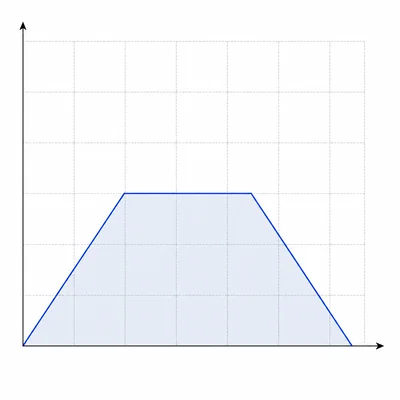
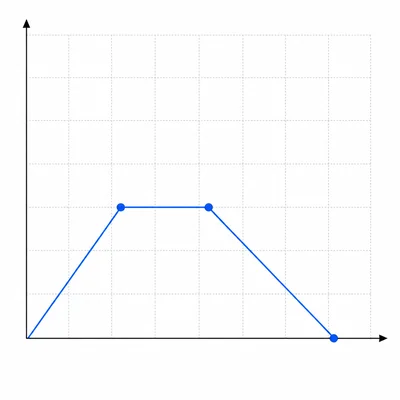
A car's velocity-time graph has three parts: it speeds up from 0 m/s to 12 m/s from 0 s to 3 s, moves at 12 m/s from 3 s to 7 s, and slows to 0 m/s from 7 s to 9 s. Find the total displacement.
- 12
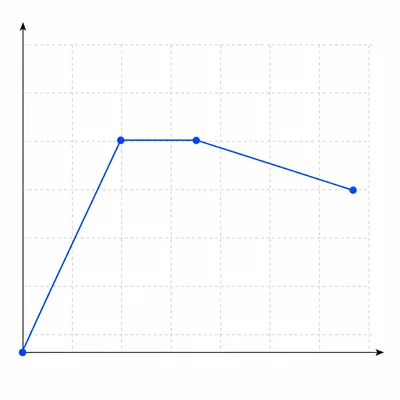
An object's position-time graph rises from 0 m to 15 m, becomes flat for a short time, and then slopes downward back toward 0 m. Describe the motion in words.
- 13
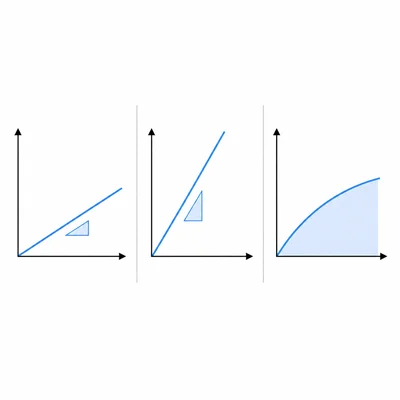
For each graph type, state what the slope or area represents: slope of a position-time graph, slope of a velocity-time graph, and area under a velocity-time graph.
- 14
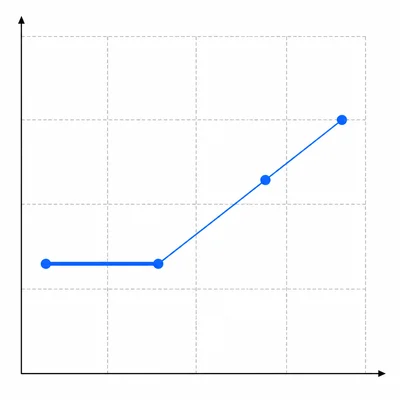
A position-time table shows these values: at 0 s the position is 5 m, at 2 s the position is 5 m, at 4 s the position is 9 m, and at 6 s the position is 13 m. During which time interval is the object stopped?
- 15
An object starts at position 0 m. Its velocity is +2 m/s from 0 s to 3 s, 0 m/s from 3 s to 5 s, and -1 m/s from 5 s to 9 s. Describe the shape of the position-time graph and give the final position.