Practice identifying sources of uncertainty, calculating percent uncertainty, propagating uncertainty, and reporting results clearly in motion experiments.
Read each problem carefully. Show your work and include units where appropriate. Round answers to a reasonable number of significant figures.
Estimating, calculating, and reporting uncertainty in motion measurements
Physics - Grade 9-12
- 1
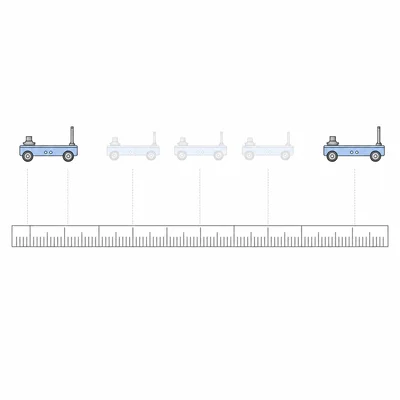
A student measures a cart's displacement with a meterstick marked every 1 mm. The cart moves from 12.4 cm to 86.7 cm. Estimate the uncertainty in each position reading and calculate the displacement with its uncertainty.
- 2
A stopwatch records a time interval of 3.42 s. The stopwatch has a resolution of 0.01 s, but the student's reaction time adds an estimated uncertainty of ±0.20 s. Which uncertainty should dominate the measurement, and how should the time be reported?
- 3
A motion sensor measures a cart's position as 1.250 m with an uncertainty of ±0.005 m. Calculate the percent uncertainty in the position measurement.
- 4
A cart travels 2.40 ± 0.02 m in 1.20 ± 0.10 s. Calculate the average speed and estimate its percent uncertainty.
- 5
A group measures the time for a toy car to travel 1.00 m in five trials: 1.26 s, 1.31 s, 1.29 s, 1.24 s, and 1.30 s. Calculate the mean time and estimate the uncertainty as half the range.
- 6
A student reports a measured acceleration as 0.847362 m/s² ± 0.08 m/s². Rewrite the result using an appropriate number of decimal places.
- 7
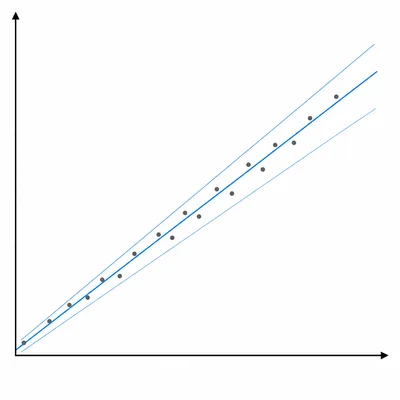
In a constant-velocity lab, a student makes a position-time graph. The best-fit line has a slope of 0.62 m/s. A steep reasonable line has a slope of 0.67 m/s, and a shallow reasonable line has a slope of 0.58 m/s. Estimate the uncertainty in the slope.
- 8
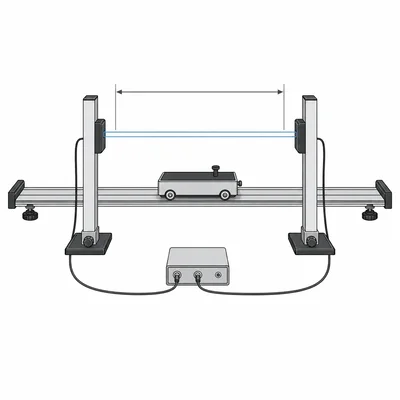
A student uses photogates to measure the time for a cart to pass between two gates. The distance between gates is 0.500 ± 0.002 m, and the time is 0.721 ± 0.001 s. Which measurement contributes more to the uncertainty in the calculated speed?
- 9
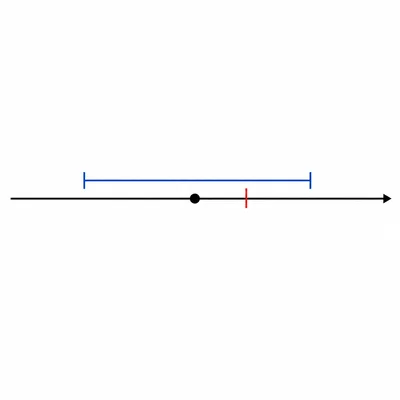
A motion lab result gives an experimental acceleration of 9.6 ± 0.4 m/s² for a falling object. The accepted value is 9.8 m/s². Does the accepted value fall within the experimental uncertainty range?
- 10
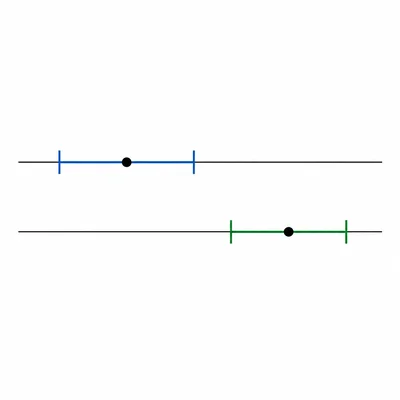
Two groups measure the same cart speed. Group A reports 1.20 ± 0.03 m/s. Group B reports 1.28 ± 0.04 m/s. Do the two results agree within uncertainty? Explain.
- 11
A student calculates velocity from two position readings: x1 = 0.15 ± 0.01 m and x2 = 1.05 ± 0.01 m. The time interval is 2.0 ± 0.1 s. Calculate the velocity and estimate its uncertainty.
- 12
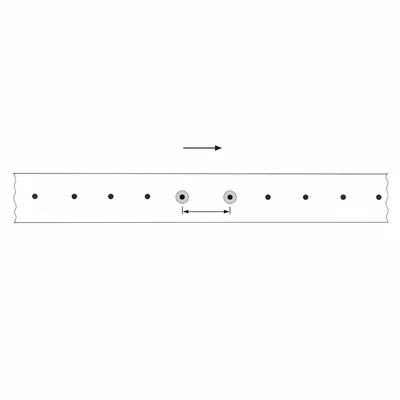
A ticker tape timer makes dots every 0.020 s. A student measures the distance between two dots as 3.6 cm with an uncertainty of ±0.1 cm. What is the speed for that interval, and what is the percent uncertainty due to the distance measurement?
- 13
A student says, "Our motion sensor gives digital readings, so there is no measurement uncertainty." Explain why this statement is incorrect.
- 14
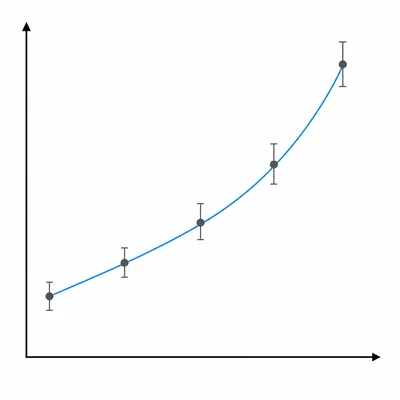
A cart rolls down a ramp. The class collects this position-time data: at 0.0 s, x = 0.00 m; at 0.5 s, x = 0.12 m; at 1.0 s, x = 0.48 m; at 1.5 s, x = 1.08 m; at 2.0 s, x = 1.92 m. The position uncertainty is ±0.02 m. Describe whether the uncertainty is likely to change the conclusion that the cart is accelerating.
- 15
In a lab report, a student writes the final result as acceleration = 1.3 m/s². List two pieces of information missing from this result that would make it scientifically stronger.