Practice key AP Psychology skills related to research methods, descriptive statistics, correlation, experiments, ethics, and interpreting psychological data.
Read each problem carefully. Show your work or explain your reasoning in the space provided.
Designing studies, interpreting data, and evaluating evidence
Psychology - Grade 9-12
- 1
A psychologist wants to study whether sleep affects memory. She randomly assigns 80 students to either sleep 8 hours or sleep 4 hours before taking the same memory test. Identify the independent variable and the dependent variable.
- 2
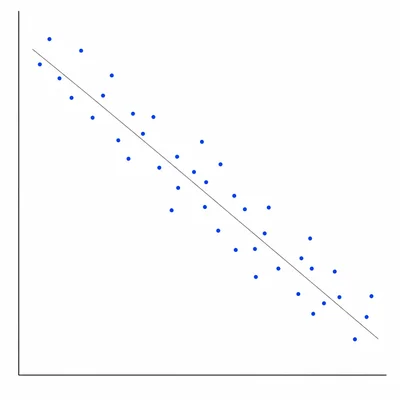
A survey finds that students who report higher stress levels also report lower sleep quality. The correlation between stress and sleep quality is -0.62. Explain what this correlation means and whether it proves that stress causes poor sleep.
- 3
A set of reaction time scores in milliseconds is 210, 230, 230, 250, 280. Find the mean, median, and mode.
- 4
A teacher tests a new study strategy in one AP Psychology class and compares the results to a different class that uses the old strategy. The students were not randomly assigned to classes. Explain one limitation of this research design.
- 5
A researcher wants a representative sample of all high school students in a large city. She only surveys students from one honors psychology class. Explain why this sample is biased and suggest a better sampling method.
- 6
A study reports that a new anxiety treatment produced a statistically significant improvement with p < .05. Explain what p < .05 means in this context.
- 7
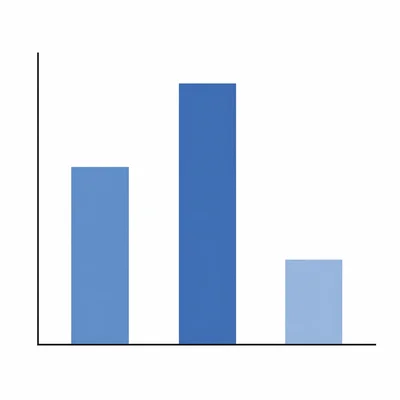
A bar graph shows the average number of words recalled by three groups: no music, classical music, and loud pop music. The loud pop music group recalled the fewest words. Write one conclusion the graph supports and one conclusion it does not support.
- 8
In a double-blind drug study, neither the participants nor the researchers interacting with them know who receives the real medication and who receives a placebo. Explain why this design is useful.
- 9
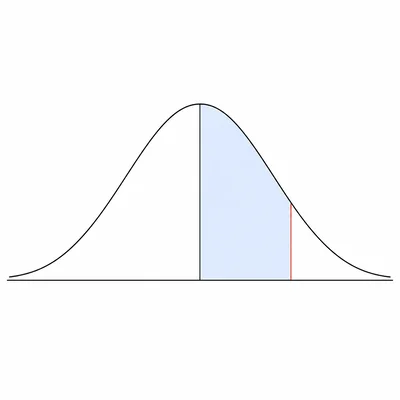
A memory test has a normal distribution with a mean of 100 and a standard deviation of 15. A student scores 130. Explain how far this score is from the mean in standard deviation units.
- 10
A psychologist observes children on a playground and records how often they share toys. The psychologist does not interfere with the children. Identify the research method and explain one strength of it.
- 11
A study about test anxiety asks participants to sign a consent form, tells them they may quit at any time, keeps their names private, and explains the study afterward. Identify two ethical principles shown in this example.
- 12
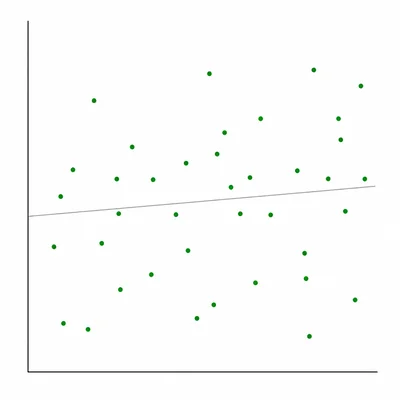
A scatterplot shows a correlation of +0.10 between hours spent studying and happiness ratings. Explain what the strength and direction of this correlation suggest.