Practice creating, reading, and comparing box-and-whisker plots using five-number summaries and real-world data.
Read each problem carefully. Show your work in the space provided.
Summarizing data with quartiles, medians, and spread
Statistics - Grade 6-8
- 1
Find the five-number summary for this data set: 4, 6, 7, 8, 10, 12, 15.
- 2

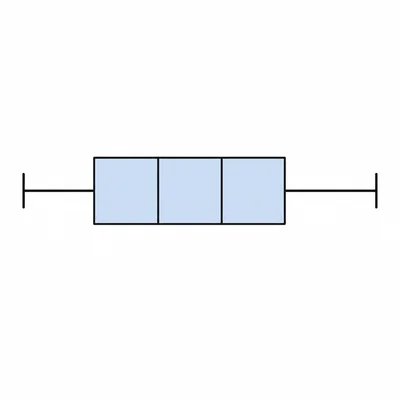
A data set has this five-number summary: minimum 2, Q1 5, median 9, Q3 14, maximum 18. Describe how to draw its box-and-whisker plot.
- 3

A box-and-whisker plot has Q1 at 12 and Q3 at 20. What is the interquartile range, or IQR?
- 4
A box-and-whisker plot has a minimum of 6 and a maximum of 31. What is the range of the data?
- 5
Look at a box-and-whisker plot with minimum 10, Q1 15, median 18, Q3 25, and maximum 30. What does the median tell you about the data?
- 6
Find the five-number summary for this data set: 18, 20, 22, 22, 25, 27, 30, 31, 33, 35, 36, 40.
- 7
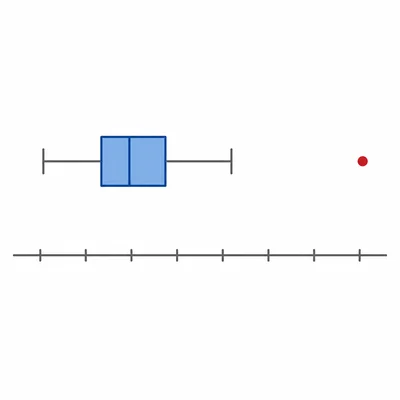
Use the 1.5 times IQR rule to check for outliers in this data set: 3, 5, 6, 6, 7, 8, 8, 9, 30.
- 8
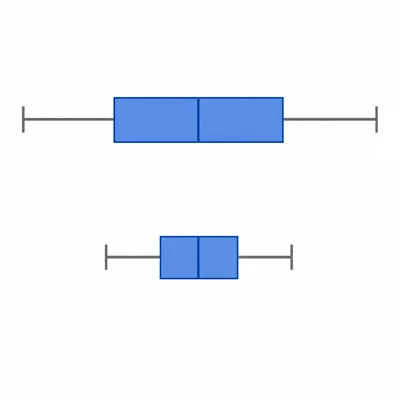
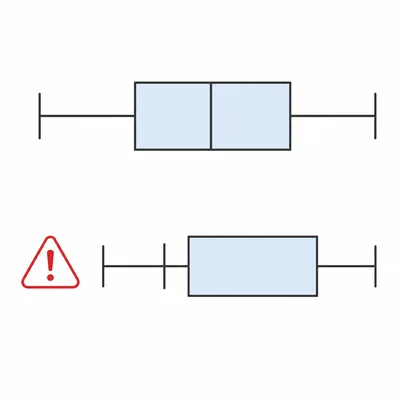
Class A has a five-number summary of 60, 70, 78, 86, 95. Class B has a five-number summary of 65, 75, 80, 83, 90. Which class has scores that are more consistent, and why?
- 9
In a box-and-whisker plot, about what percent of the data values are at or below Q3?
- 10

A box-and-whisker plot has minimum 2, Q1 4, median 5, Q3 9, and maximum 20. Is the data more spread out on the lower side or the upper side? Explain.
- 11
A town recorded daily rainfall amounts in millimeters: 0, 0, 1, 2, 2, 3, 3, 4, 10, 12. Find the five-number summary.
- 12
A student says a box-and-whisker plot has Q1 at 8, median at 7, and Q3 at 12. Explain the mistake.
- 13
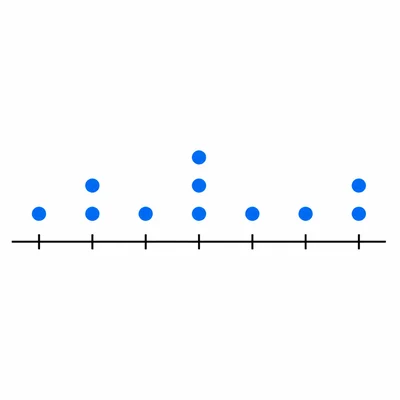
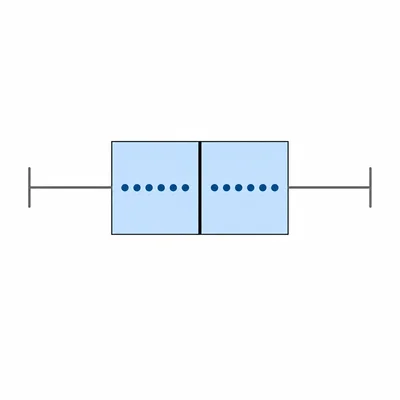
A dot plot shows this data set: 1, 2, 2, 3, 4, 4, 4, 5, 6, 7, 7. Find the five-number summary that would be used to make a box-and-whisker plot.
- 14

A box-and-whisker plot for test scores has a median of 84. What does this mean? What does it not mean?
- 15

Which data set matches a box-and-whisker plot with minimum 10, Q1 15, median 20, Q3 24, and maximum 30? A: 10, 15, 15, 20, 22, 24, 30. B: 10, 12, 15, 20, 24, 28, 30. C: 10, 15, 18, 20, 24, 24, 30.