Practice finding the mean, median, and mode of small data sets using numbers, lists, and simple graphs.
Read each problem carefully. Show your work in the space provided. For mean, add the numbers and divide by how many numbers there are.
For median, put the numbers in order and find the middle. For mode, find the number that appears most often.
Practice describing data sets with averages and common values
Statistics - Grade 4-5
- 1
Find the mean of these quiz scores: 8, 10, 7, 9, 6.
- 2
Find the median of these numbers: 12, 7, 9, 15, 10.
- 3
Find the mode of these pet ages: 3, 5, 2, 3, 4, 3, 5.
- 4
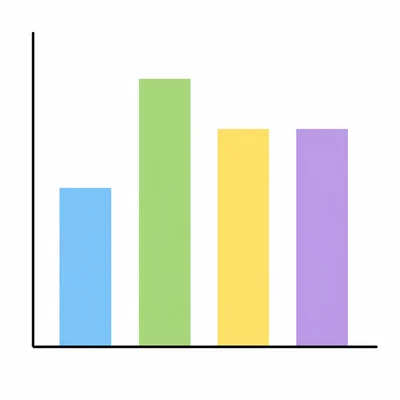
The bar graph shows the number of books read by four students: Ana read 4, Ben read 6, Cara read 5, and Darius read 5. Find the mean number of books read.
- 5
Find the mean, median, and mode of this data set: 4, 6, 6, 8, 11.
- 6
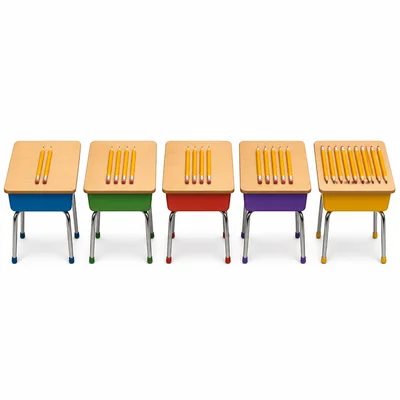
A class counted how many pencils were in five desks: 2, 4, 4, 5, 10. Which measure, mean or median, better describes a typical desk? Explain your choice.
- 7
Find the median of these temperatures: 68, 72, 70, 71, 69, 73.
- 8
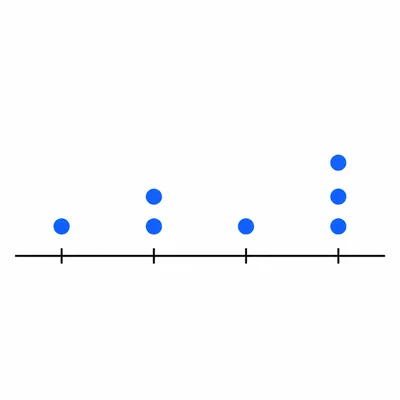
The line plot shows points at 1, 2, 2, 3, 4, 4, and 4. Find the mode of the data.
- 9
Mia's scores on four spelling tests were 9, 10, 8, and 9. What score would she need on a fifth test to have a mean of 9?
- 10
Find the mode of this data set: 6, 7, 8, 9, 10.
- 11
The table shows the number of goals scored by a team in six games: Game 1: 2, Game 2: 1, Game 3: 3, Game 4: 2, Game 5: 4, Game 6: 0. Find the mean number of goals.
- 12
Find the mean, median, and mode of these numbers of stickers: 5, 7, 5, 9, 8, 5, 10.
- 13
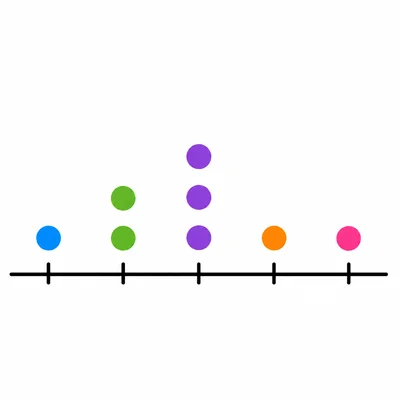
The dot plot shows the number of siblings for 8 students: 0, 1, 1, 2, 2, 2, 3, 4. Find the median number of siblings.
- 14
A data set has these numbers: 14, 12, 16, 12, 11. Jaden says the median is 16 because it is in the middle of the list as written. Is Jaden correct? Explain.
- 15
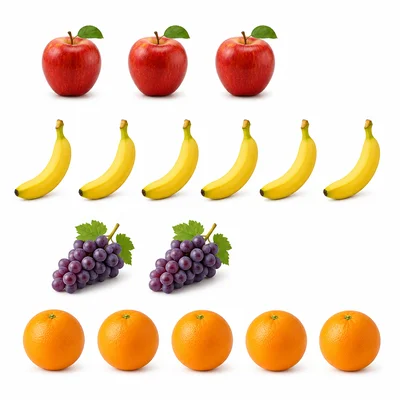
The picture graph shows favorite fruits in a small group: apples have 3 votes, bananas have 5 votes, grapes have 2 votes, and oranges have 5 votes. Which fruits are the modes?