Federal Budget Builder
Set total revenue, divide spending across the big federal categories, and see whether the year ends in a deficit or a surplus. Then project the national debt and the growing cost of interest over the years ahead. All figures are illustrative round numbers chosen for teaching, not an exact current-year budget.
Back to all tools.
Build the budget
Scenarios
Spending by category ($ trillions)
Net interest is not a slider. It equals the current debt times the interest rate, so it rises as the debt grows.
All figures are illustrative round numbers chosen for teaching, not an exact current-year budget.
Results
Total spending
$6.66T
$5.60T programs + $1.06T interest
Total revenue
$4.90T
Annual balance
-$1.76T
Deficit
Net interest cost
$1.06T
15.9% of spending
Debt after 10 yr
$53.32T
from $33.00T today
Debt to GDP
122%
197% at year 10 (GDP $27T)
To erase this year's deficit you would need to cut about $1.76T of program spending, or raise about $1.76T of revenue.
Spending vs revenue ($ trillions)
Projected national debt ($ trillions)
How Government Budgets Work
Deficit vs debt
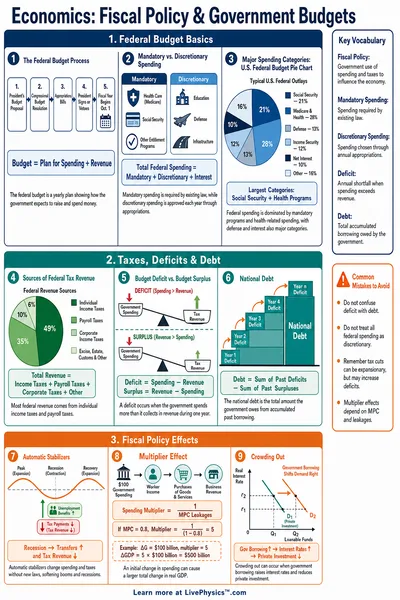
The deficit is a one-year figure. It is the gap between what the government spends in a year and what it collects in revenue. A surplus is the opposite, when revenue is larger than spending.
The debt is the running total. Each year's deficit is borrowed and added to the debt, while a surplus pays a little of it back. A small annual deficit can still pile up into a large debt over many years.
Mandatory vs discretionary
Mandatory spending is set by existing law, such as Social Security and the big health programs. It continues automatically unless lawmakers change the underlying rules.
Discretionary spending is decided each year through appropriations, and it covers areas like defense, education, transportation, and research. The labels in the tool mark which category is which so you can see how much of the budget is set in advance.
How interest compounds
Net interest is the cost of borrowing. It equals the outstanding debt times the interest rate, so it is not something you set directly. As the debt grows, the interest bill grows with it.
That feedback can compound. A larger debt means more interest, which adds to the deficit, which adds more to the debt. Try raising the interest rate in the tool and watch the projected debt line bend upward faster.