Moon Visibility Simulator
Explore the Moon's phase, illumination, rise and set times, and sky position for any date and location on Earth. Adjust the time slider to watch the Moon move across the sky throughout the day.
Moon Visibility Simulator
Select a date and location to see the moon's phase, position, and visibility.
Reference Guide
Moon Phases Explained
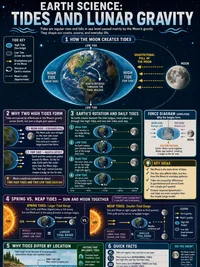
The Moon takes 29.5 days (the synodic period) to complete one full cycle of phases. Phases result from changing viewing angles as the Moon orbits Earth, not from Earth's shadow.
- New Moon. Moon between Earth and Sun. The near side is unlit.
- First Quarter. Moon at 90 degrees. Right half lit (northern hemisphere).
- Full Moon. Earth between Moon and Sun. Near side fully lit.
- Last Quarter. Moon at 270 degrees. Left half lit (northern hemisphere).
Waxing means the lit area is growing; waning means it is shrinking.
Illumination and Phase
At new moon, 0% of the visible face is lit. At full moon, 100% is lit. The illuminated fraction follows a cosine curve
This means the Moon spends more time near new and full phases than near the quarters, which is why gibbous and crescent phases dominate the monthly cycle.
The terminator (the line between lit and dark portions) traces an arc across the lunar surface, revealing the most surface detail where shadows are longest.
Rising and Setting
The Moon rises about 50 minutes later each day due to its eastward orbital motion across the sky. This gives rise to a distinctive pattern
- New Moon. Rises near sunrise, sets near sunset (not easily visible).
- First Quarter. Rises near noon, sets near midnight.
- Full Moon. Rises near sunset, visible all night.
- Last Quarter. Rises near midnight, visible in morning.
Rise and set times also vary with latitude and the Moon's declination, which changes throughout the month.
Moon's Distance
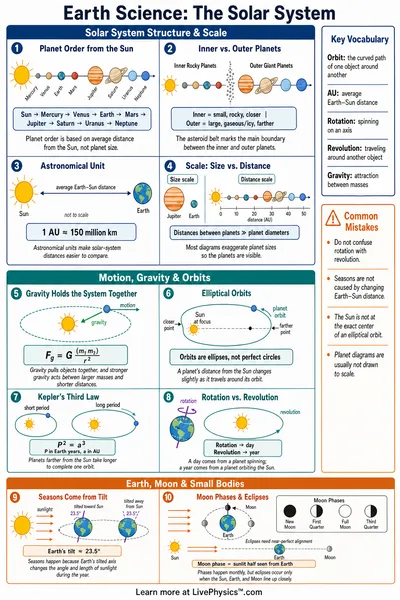
The Moon's average distance is 384,400 km, ranging from 356,500 km at perigee (closest point) to 406,700 km at apogee (farthest point).
A "supermoon" occurs when a full moon coincides with perigee, making the Moon appear up to 14% larger and 30% brighter than a typical full moon.
The Moon's elliptical orbit means its speed also varies, it moves fastest near perigee and slowest near apogee, so a synodic month is not exactly the same length each time.
Observing the Moon
The Moon is visible in daylight about half the time. The sky position diagram above shows whether the Moon is above the horizon for your selected time and location.
The best surface detail is visible near the terminator (the boundary between lit and dark areas), where craters and mountains cast long shadows. This is most dramatic during crescent and quarter phases, not at full moon.
The sky position diagram uses a horizon coordinate system, distance from center represents altitude (90 degrees at center), and direction around the circle represents azimuth (N at top, E at right).