Real-Time Satellite Tracker
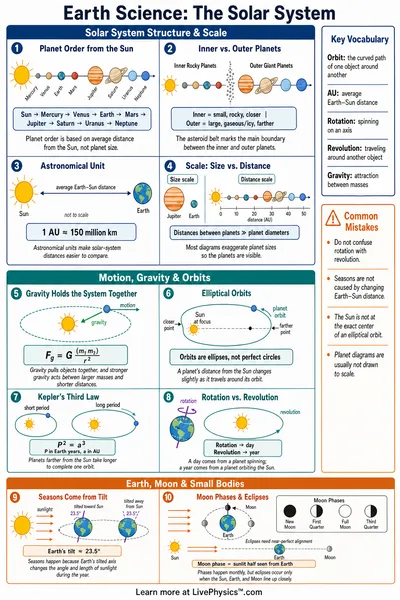
Watch the International Space Station, Starlink internet satellites, and GPS navigation satellites orbit Earth right now. Orbital data is fetched live from Celestrak using SGP4 propagation.
How Satellite Tracking Works
Two-Line Elements (TLE)
Every tracked satellite has a TLE, a compact two-line dataset from NORAD describing its orbit at a reference epoch. The six Keplerian elements (inclination, RAAN, eccentricity, argument of perigee, mean anomaly, mean motion) define the orbit shape and orientation.
SGP4 Propagation
The Simplified General Perturbations 4 (SGP4) model propagates a TLE forward in time accounting for atmospheric drag, Earth's oblateness (J2 perturbation), and lunar/solar gravity. It predicts position to within a few kilometers over a few days.
ECI to Geodetic Conversion
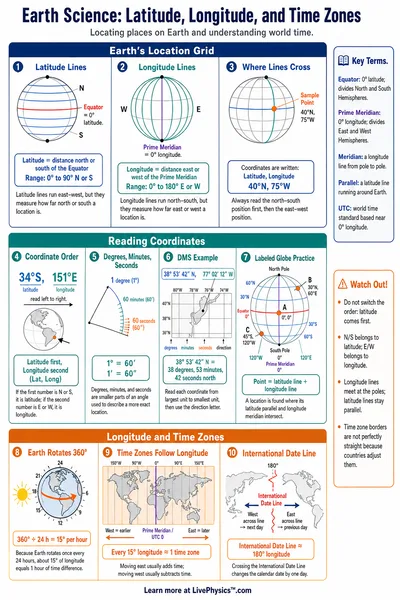
SGP4 outputs position in Earth-Centered Inertial (ECI) coordinates, a fixed reference frame. Converting to geodetic latitude/longitude requires accounting for Earth's rotation via Greenwich Mean Sidereal Time (GMST) at the propagation epoch.
ISS Orbital Parameters
The International Space Station orbits at approximately 400 km altitude in a nearly circular orbit inclined 51.6 degrees to the equator. This high inclination allows it to fly over most populated areas.
- Altitude ~400 km (395-410 km)
- Speed ~7.66 km/s (27,600 km/h)
- Orbital period ~92.5 minutes
- Inclination 51.64 degrees
- Orbits per day ~15.5
Constellation Comparisons
Different satellite constellations serve different purposes and occupy different orbital shells.
- ISS 400 km, LEO, 92.5 min period
- Starlink 550 km, LEO, 95 min period
- GPS 20,200 km, MEO, 12 hr period
- GEO Comms 35,786 km, appears stationary
Starlink Constellation
SpaceX's Starlink constellation provides global broadband internet. Satellites orbit at 540-570 km in multiple orbital shells with inclinations of 53, 70, and 97.6 degrees, providing coverage from 53 degrees S to 53 degrees N latitude and beyond.
GPS Constellation
The GPS constellation maintains 31 operational satellites (plus spares) in 6 orbital planes at 20,200 km altitude. Each satellite broadcasts timing signals; a receiver needs signals from 4 satellites for a 3D position fix. The 12-hour period means each satellite repeats its ground track twice per day.
Ground Track
A satellite's ground track is the path its subsatellite point traces on Earth's surface. For LEO satellites, Earth's rotation causes the track to shift westward by about 22 degrees per orbit. After 15 orbits the ISS is back roughly over the same ground.