Sign in to save

Bookmark this page so you can find it later.

Sign in to save

Bookmark this page so you can find it later.

Time Zone Physics Tool

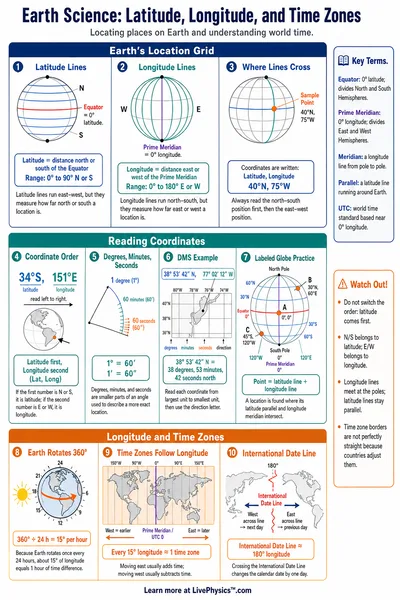
Earth rotates 15 degrees per hour, which is why time zones exist. Drag the time slider to move the sun, click any location to see its solar time, and explore why noon is different everywhere.

Sun position
Selected location
Click location to analyze · Drag to rotate
UTC Time22:45 UTC
00:0006:0012:0018:0023:59

Jump to City

Click anywhere on the globe to see solar time, timezone offset, and rotation speed at that location.

Major Cities - Local Solar Time

CitySolar TimeStatusStd TZ
New York17:49DayEST (UTC-5)
London22:45NightGMT (UTC+0)
Paris22:55NightCET (UTC+1)
Dubai02:27NightGST (UTC+4)
Mumbai03:37NightIST (UTC+5:30)
Tokyo08:04DayJST (UTC+9)
Sydney08:50DayAEDT (UTC+11)
Los Angeles14:53DayPST (UTC-8)

The Physics of Time Zones

15 Degrees per Hour

Earth rotates 360 degrees every 24 hours, which is exactly 15 degrees per hour. Every 15 degrees of longitude represents one hour of solar time difference. The theoretical time zone width is exactly 15 degrees.

Solar vs Standard Time

Solar noon (when the sun is highest) varies continuously with longitude. Standard time zones are political approximations that keep large regions on the same clock, so solar noon can differ from 12:00 by up to an hour or more.

Rotation Speed

The equator moves at about 1670 km/h due to Earth's rotation. This speed decreases with latitude as the circumference gets smaller. At the poles, the rotation speed is essentially zero.

Related Content

Related Tools

Earthquake Magnitude Calculator
Four modes: magnitude scales (Richter Mₗ, moment magnitude M𝑤, energy), energy comparison (each step = 31.6× more energy, logarithmic bar chart), Modified Mercalli Intensity I-XII with descriptions, and Richter magnitude from seismograph amplitude. Presets include Minor M3 through Great M8, 1906 San Francisco M7.9, and 2011 Japan M9.1.
Carbon Footprint Calculator
Estimate annual CO₂ emissions from transportation (car miles, fuel type, flights), home energy (electricity, heating, AC), diet (meat consumption, food waste), and lifestyle (shopping, recycling). Pie chart breakdown, country comparison bar chart, trees-to-offset and equivalent-driving metrics. Five presets: Average American, Eco-Conscious, Heavy Commuter, Frequent Flyer, Work from Home.
Star Lifecycle Visualizer
Three modes: interactive HR diagram with 23 real stars (click to see properties), stellar evolution pathway from nebula to end state (white dwarf, neutron star, or black hole based on initial mass), and star properties calculator (luminosity L∝M^3.5, radius, lifetime t∝M^-2.5, apparent magnitude). Six presets: Sun, Red Dwarf (0.3 M☉), Sirius A (2 M☉), Blue Giant (20 M☉), Betelgeuse (15 M☉), Supergiant (50 M☉). Includes spectral class colour strip and SVG star visualization.
H-R Diagram Explorer
Three modes: plot a single star on the Hertzsprung-Russell diagram from temperature, radius, and mass (Stefan-Boltzmann luminosity, spectral class O-M, absolute magnitude, HR region); compare multiple stars side by side; and browse the spectral atlas with typical properties for each class. 23 reference stars plotted, 6 presets from Proxima Centauri to Rigel.