Practice interpreting R0, outbreak curves, and the effects of interventions on infectious disease spread.
Read each problem carefully. Show your reasoning, calculations, or graph interpretations in the space provided.
Analyzing disease spread, outbreak graphs, and public health strategies
Biology - Grade 9-12
- 1
Define R0 in your own words. Explain what it means if a disease has an R0 of 3 in a fully susceptible population.
- 2
A disease has an R0 of 0.8. Predict whether the outbreak is likely to grow or shrink over time, and explain why.
- 3
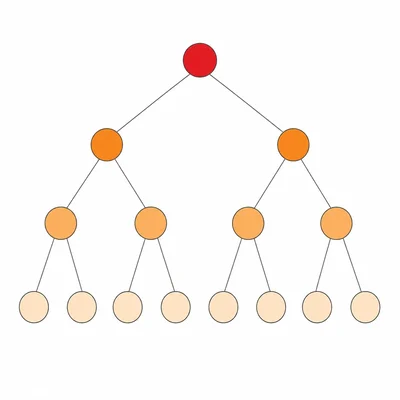
In a town, one infected traveler starts an outbreak. The disease has an R0 of 2. If conditions stay the same, estimate the number of new infections in the next three rounds of transmission after the traveler. Show the pattern.
- 4
A virus has an R0 of 4. What fraction of the population would need immunity to reach the herd immunity threshold? Use the formula: herd immunity threshold = 1 - 1/R0.
- 5
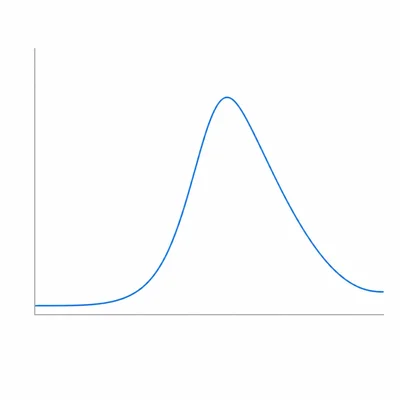
Look at an outbreak graph where the number of new cases rises slowly at first, then rapidly increases, reaches a peak, and then declines. Describe what this graph suggests about the course of the outbreak.
- 6
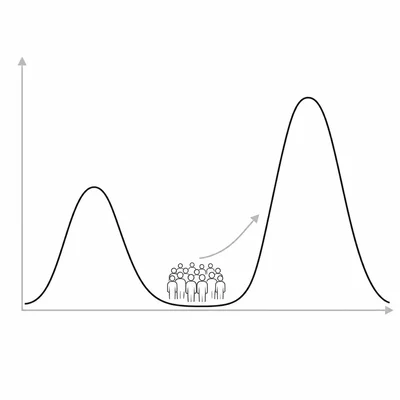
An epidemic curve shows two separate peaks, with the second peak occurring about one incubation period after a large public event. What is a reasonable explanation for the second peak?
- 7
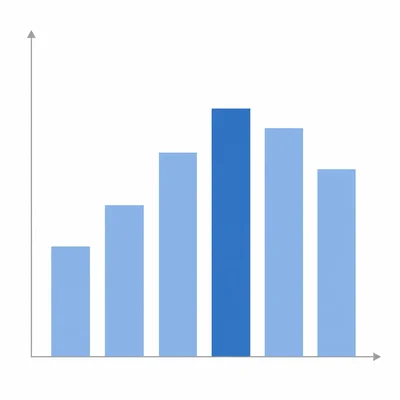
A county reports these new cases over 6 weeks: Week 1: 10, Week 2: 18, Week 3: 35, Week 4: 70, Week 5: 68, Week 6: 40. Identify the week when new cases peaked and describe the overall trend.
- 8
Explain the difference between incidence and prevalence using an infectious disease example.
- 9
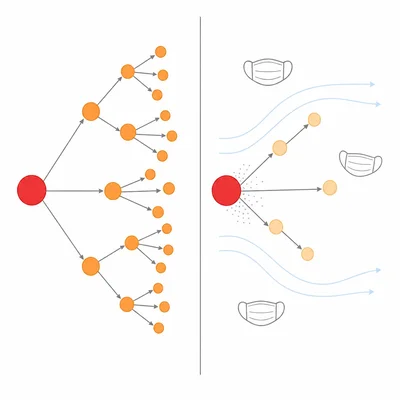
A school introduces a mask policy and improves ventilation. Before the policy, the effective reproduction number was 1.6. After the policy, it drops to 0.9. Explain what this change means for the outbreak.
- 10
Compare R0 and Rt. Why is Rt often more useful during an ongoing outbreak?
- 11
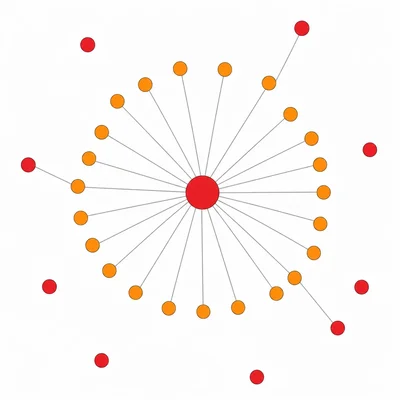
A contact tracing team finds that one infected person attended a crowded indoor party and infected 12 people, while most infected people infected no one. Explain how superspreading can affect outbreak control.
- 12
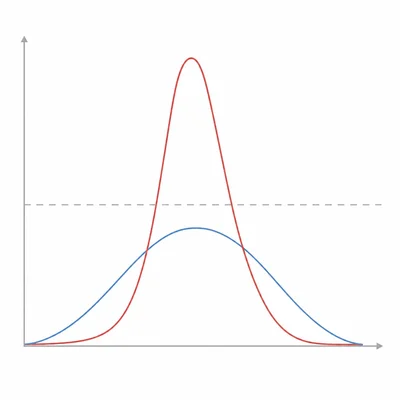
A graph compares two outbreak curves. Curve A is tall and narrow, while Curve B is shorter and wider. Both curves include about the same total number of cases. Explain which curve would be easier for hospitals to manage and why.
- 13
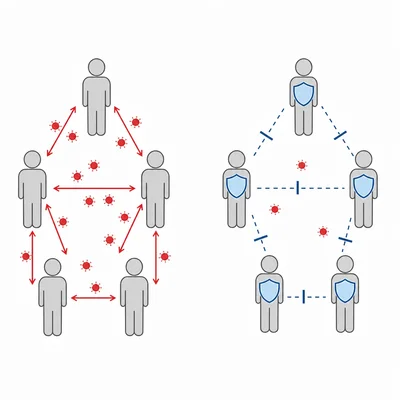
A vaccine reduces the chance that a vaccinated person becomes infected and also reduces their chance of transmitting the pathogen if infected. Explain two ways this can lower Rt.
- 14
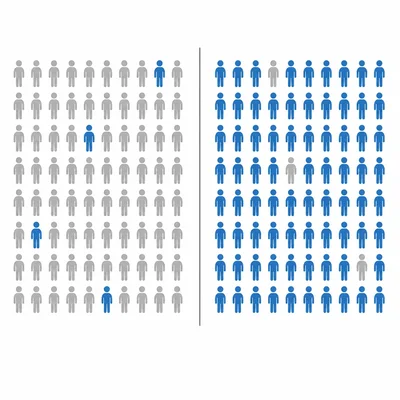
In a city of 100,000 people, 20,000 people are currently immune to a disease. The disease has an R0 of 2.5. Use the herd immunity threshold formula to decide whether the city has enough immunity to prevent sustained spread.
- 15
A public health department must choose between starting isolation of confirmed cases, contact tracing, vaccination clinics, and public communication. Explain how using several interventions together can reduce an outbreak more effectively than using only one.