Hardy-Weinberg & Natural Selection Lab
Investigate how allele frequencies change across generations under different evolutionary forces. Start with a population in Hardy-Weinberg equilibrium, then apply selection, drift, mutation, or migration to observe evolution in action.
Guided ExperimentTesting Hardy-Weinberg Equilibrium
If a population meets all five Hardy-Weinberg conditions (no selection, no drift, no mutation, no migration, random mating), what do you predict will happen to allele frequencies over 50 generations?
Write your hypothesis in the Lab Report panel, then click Next.
Controls
Results
Run the simulation to see results. Adjust parameters on the left and click Run.
Allele Frequency Over Generations
Run the simulation to see the allele frequency trajectory.
Chi-Square Goodness-of-Fit Analyzer
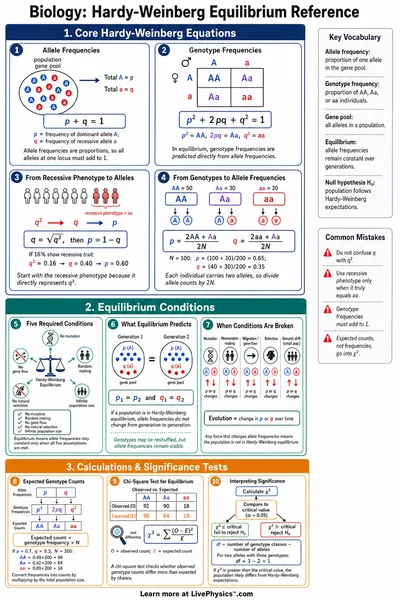
Enter observed genotype counts. The analyzer estimates allele frequencies, computes expected counts under Hardy-Weinberg, runs a chi-square goodness-of-fit test with df = 1, and decides whether to reject the HW null hypothesis.
Observed counts
Expected vs observed
| Genotype | Observed (O) | Expected (E) | (O − E)² / E |
|---|---|---|---|
| AA | 49 | 50.00 | 0.020 |
| Aa | 102 | 100.00 | 0.040 |
| aa | 49 | 50.00 | 0.020 |
| Total | 200 | 200.00 | χ² = 0.080 |
Because χ² does not exceed the critical value, we fail to reject the null hypothesis. The observed genotype frequencies are consistent with Hardy-Weinberg equilibrium given the estimated allele frequencies, but this does not prove HWE holds, only that the data are not inconsistent with it.
Degrees of freedom = 3 genotype classes − 1 estimated parameter (p) − 1 constraint (counts sum to N) = 1.
Data Table
(0 rows)| # | Trial | Generation | p (A) | q (a) | Freq AA | Freq Aa | Freq aa | Chi-Square | In Equilibrium? |
|---|
Reference Guide
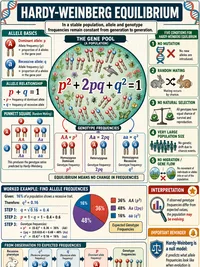
Hardy-Weinberg Principle
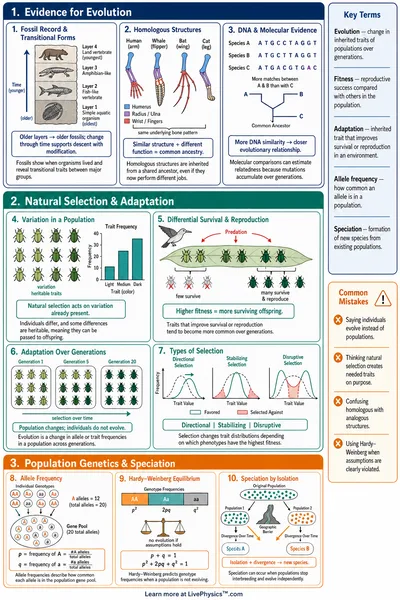
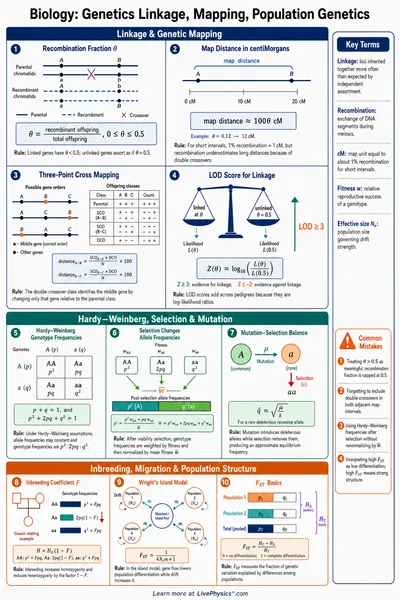
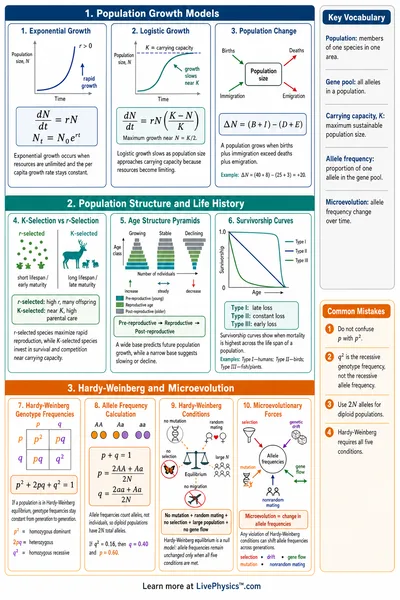
In a non-evolving population, allele and genotype frequencies remain constant across generations.
Where p is the frequency of the dominant allele (A) and q is the frequency of the recessive allele (a).
Conditions for Equilibrium
Five conditions must hold for a population to stay in Hardy-Weinberg equilibrium.
- No natural selection (all genotypes equally fit)
- No genetic drift (infinitely large population)
- No mutation (alleles do not change)
- No migration (no gene flow in or out)
- Random mating (no sexual selection)
Violating any condition causes allele frequencies to change, which means evolution is occurring.
Chi-Square Test
The chi-square goodness-of-fit test determines whether observed genotype frequencies match HW expectations.
With df = 1. If the p-value is greater than 0.05, the population is consistent with Hardy-Weinberg equilibrium.
Evolutionary Forces
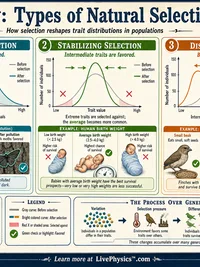
Natural Selection favors alleles that increase fitness. Genotypes with higher w contribute more offspring.
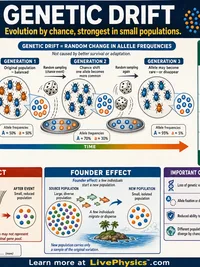
Genetic Drift causes random changes in allele frequencies, especially in small populations.
Mutation introduces new alleles or converts existing ones, slowly shifting frequencies.
Migration (gene flow) brings alleles from other populations, moving frequencies toward the migrant pool.