Understanding Immune System Defense Simulator
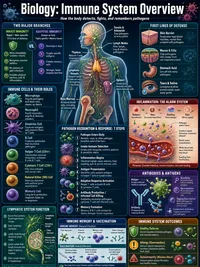
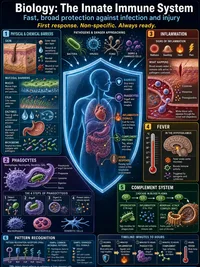
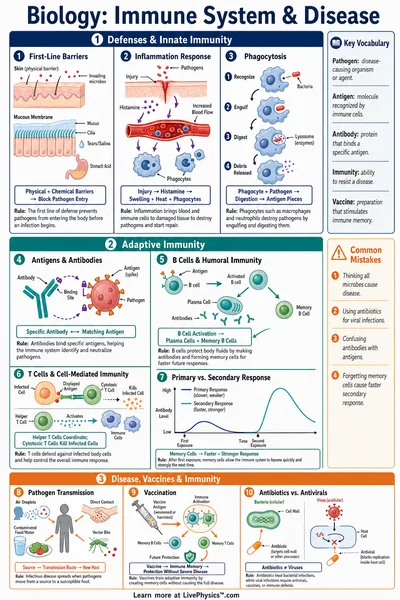
The first hours of an infection are shaped by barriers that are easy to overlook. Skin, mucus, stomach acid, and helpful microbes can stop many invaders before immune cells need to respond. A simulator usually begins after a pathogen has passed some of these barriers and started multiplying.
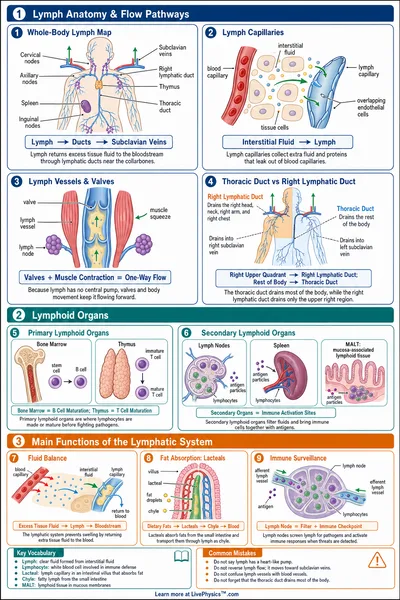
Inflammation is one early signal worth reading carefully on a chart. Chemicals released near infected tissue make blood vessels leakier, allowing neutrophils and macrophages to leave the blood and enter the area. This response can cause warmth, swelling, tiredness, or fever even while it helps control the infection.
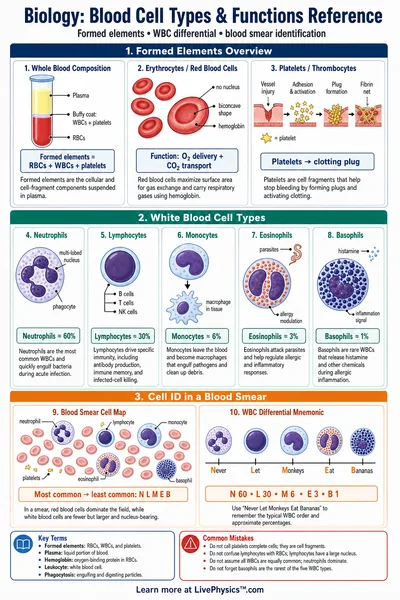
Neutrophils are fast, short-lived cells that mainly attack bacteria and damaged tissue. Macrophages can swallow microbes, clear cell debris, and send signals that recruit other immune cells. Their curves may rise early because the body needs a rapid response before it has made a tailored defense.
Viruses such as influenza and many common cold viruses reproduce inside body cells. Killing an infected cell can limit viral production, but it can injure tissue at the same time. This helps explain why symptoms can remain unpleasant after the amount of virus has begun to fall.
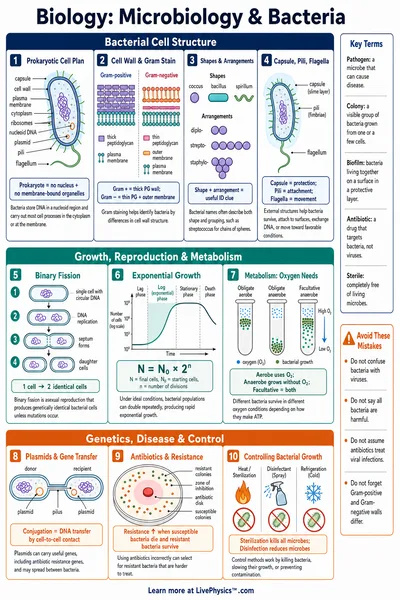
Strep infections are commonly caused by bacteria that grow outside human cells, often in the throat. E. coli describes a large group of bacteria, with some strains living harmlessly in the gut while others cause disease. The name of a pathogen gives useful clues, but the infection site and strain strongly affect the outcome.
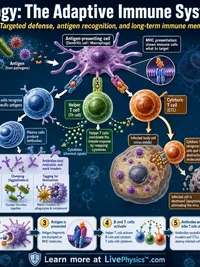
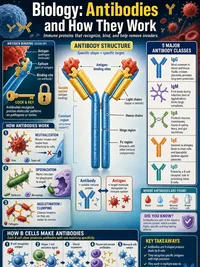
B cells make antibodies that bind to particular parts of a pathogen. Bound antibodies can block a virus from entering cells, mark bacteria for destruction, or help immune cells find their target. Antibody levels normally rise later than the first innate cell response because B cells need time to activate and multiply.
T cells have different jobs from B cells. Helper T cells coordinate parts of the immune response through chemical messages, while killer T cells can destroy infected body cells. A high T-cell line does not simply mean a person is sicker, since it may show an effective targeted response.
Vaccines train immune cells without requiring the full disease to occur. Memory B cells and memory T cells remain after this training and react more quickly during a later exposure. In a comparison chart, this can appear as an earlier antibody rise, a lower pathogen level, or a shorter period of severe symptoms.
Vaccination does not always prevent every infection. Some pathogens change their surface proteins, immunity can weaken over time, and a vaccine may be designed mainly to reduce severe disease. A vaccinated result should therefore be read as lower risk rather than a guarantee of zero symptoms.
Severity scores combine several biological effects into one simple value. They may reflect pathogen amount, inflammation, tissue damage, or the time needed for the response to gain control. Real symptoms vary between people, so a score is best treated as a model output rather than a personal medical prediction.
The clearance day is another useful estimate, but it is not a sharp biological finish line. Small numbers of microbes or viral particles may remain below the model threshold, while healing continues after active infection is controlled. Look for the overall trend of pathogen decline alongside the timing of immune peaks.
When reading several lines together, focus on cause and timing rather than on the highest value alone. An early innate peak followed by antibodies and T-cell activity represents a coordinated sequence with delays built into it. Simulations simplify this process, yet they are valuable for showing why previous exposure, pathogen type, and response timing can change the course of illness.