Practice understanding what data is, how it is collected, and how different types of data can be used to answer statistical questions.
Read each problem carefully. Show your thinking and write complete answers in the space provided.
Recognizing, collecting, and describing data
Statistics - Grade 6-8
- 1
In your own words, explain what data is. Then give one example of data a teacher might collect in a classroom.
- 2
A student asks 20 classmates, "How many pets do you have at home?" Is the information collected data? Explain why or why not.
- 3
Classify each item as data or not data: a list of lunch choices, one person's opinion that pizza is best, the heights of students in centimeters, a blank notebook page.
- 4
The table shows the number of books read by five students: Ana 4, Ben 2, Cora 7, Diego 3, Emma 4. What question could this data help answer?
- 5
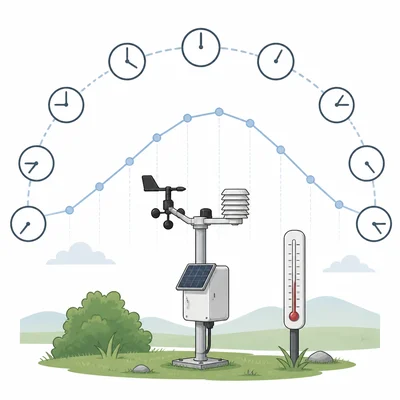
A weather station records the temperature outside every hour for one day. Is this a good example of data collected over time? Explain.
- 6
Decide whether each example is numerical data or categorical data: eye color, number of siblings, shoe size, favorite sport.
- 7
A survey asks students to choose their favorite school subject from math, science, language arts, social studies, or art. What type of data will the survey collect? Explain.
- 8
A coach records how many laps each runner completes in 10 minutes. What type of data is being collected? Explain what the numbers represent.
- 9
Look at this data set: 12, 15, 13, 18, 12, 16. What might these numbers represent? Give two possible meanings for the data set.
- 10
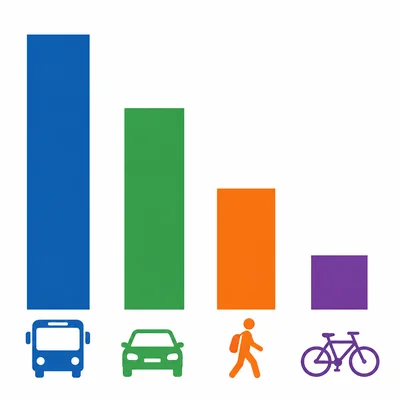
A bar graph shows how students travel to school: bus 12, car 8, walk 5, bike 3. What data was collected to make the graph?
- 11
Write one statistical question and one non-statistical question about students in your school. Explain the difference.
- 12
A student wants to know the most popular fruit in the cafeteria. They ask only their two best friends. Explain why this may not be enough data.
- 13
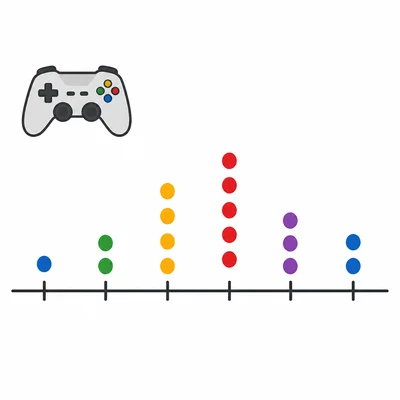
The dot plot shows the number of hours students spent playing video games on Saturday. What does each dot represent?
- 14
A data set contains the following entries: red, blue, red, green, blue, blue, red. What kind of data is this, and what could it represent?
- 15
Choose the better way to collect data for the question, "How much water do students drink during the school day?" Option A: Guess based on one student. Option B: Ask many students to record the number of water bottles or cups they drink in one day. Explain your choice.