Practice making and reading simple graphs to answer questions about data.
Read each problem carefully. Use the data to answer the question. Show your work in the space provided.
Practice using picture graphs, bar graphs, and tally charts
Statistics - Grade 2-3
- 1
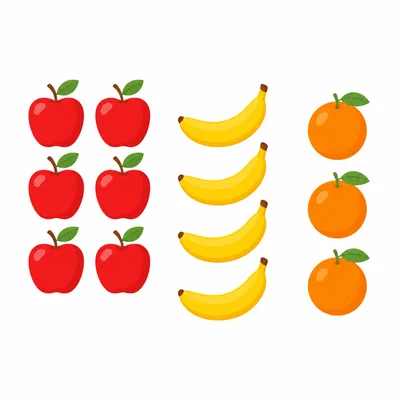
A class voted for favorite fruits. Apples got 6 votes, bananas got 4 votes, and oranges got 3 votes. Which fruit got the most votes?
- 2
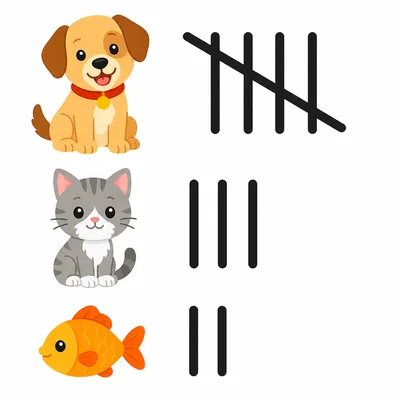
Use this tally chart: Dogs have 5 tallies, cats have 3 tallies, and fish have 2 tallies. How many pets are shown in all?
- 3

A bar graph shows books read by three students. Mia read 7 books, Leo read 5 books, and Sam read 7 books. Which students read the same number of books?
- 4
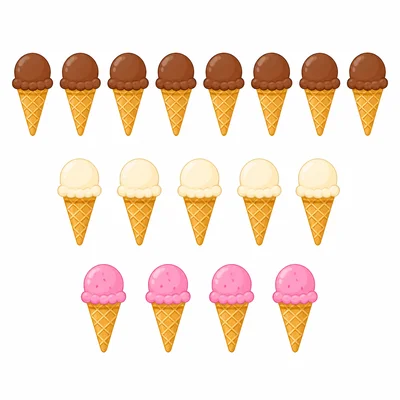
A picture graph shows ice cream flavors sold. Each ice cream cone picture equals 1 sale. Chocolate has 8 pictures, vanilla has 5 pictures, and strawberry has 4 pictures. How many more chocolate cones were sold than strawberry cones?
- 5

Make a bar graph for this data: red balloons 4, blue balloons 6, green balloons 2. Which color should have the tallest bar?
- 6

A class counted the weather for one school week. Sunny days: 3. Rainy days: 1. Cloudy days: 1. How many days were counted in all?
- 7
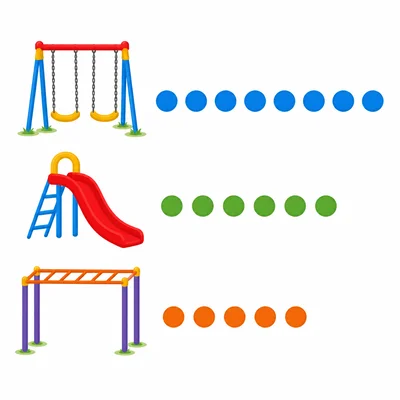
A graph shows favorite playground activities. Swings got 9 votes, slide got 6 votes, and monkey bars got 5 votes. How many votes did swings and slide get together?
- 8
Look at this data for stickers collected: Ana has 12 stickers, Ben has 9 stickers, and Cara has 6 stickers. Who has the fewest stickers?
- 9

A picture graph uses one star picture to mean 2 points. Team A has 4 star pictures. How many points does Team A have?
- 10

A class made a tally chart of favorite school subjects. Math: 8 votes. Reading: 7 votes. Art: 10 votes. Science: 5 votes. Which subject got the greatest number of votes?
- 11
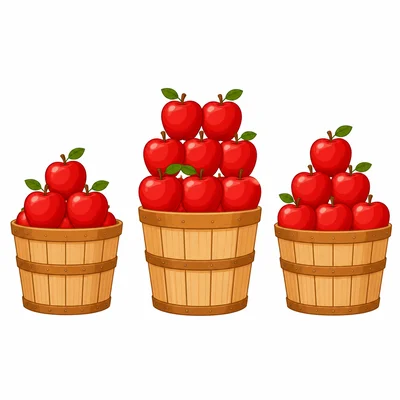
A bar graph shows the number of apples picked each day. Monday: 5 apples. Tuesday: 8 apples. Wednesday: 6 apples. How many more apples were picked on Tuesday than on Monday?
- 12

Make a picture graph for favorite pets. Dogs: 6 votes. Cats: 4 votes. Birds: 2 votes. Use one picture to stand for one vote. How many pictures should you draw for cats?
- 13
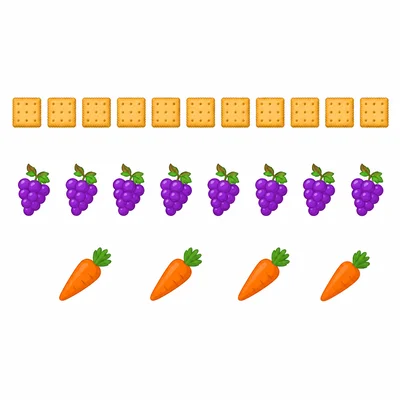
A graph shows how many students chose each snack. Crackers: 11 students. Grapes: 8 students. Carrots: 4 students. How many students chose grapes or carrots?
- 14
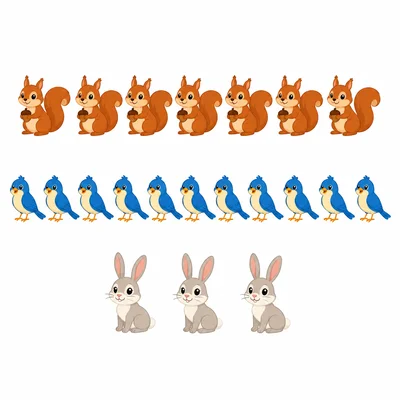
A picture graph shows animals seen at a park. Each animal picture equals 1 animal. Squirrels: 7 pictures. Birds: 10 pictures. Rabbits: 3 pictures. Which animal was seen the least?
- 15
A class survey asked students how they get to school. Bus: 9 students. Walk: 5 students. Car: 6 students. Bike: 2 students. How many students answered the survey in all?