Practice calculating and interpreting measures of center and spread for numerical data sets.
Read each problem carefully. Show your work in the space provided.
Finding mean, median, mode, range, and variability
Statistics - Grade 6-8
- 1
Find the mean of this data set: 6, 8, 10, 12, 14.
- 2
Find the median of this data set: 15, 9, 12, 18, 11.
- 3
Find the mode of this data set: 4, 7, 7, 9, 10, 10, 10, 12.
- 4
Find the range of this data set: 23, 18, 31, 25, 20.
- 5
A student recorded the number of minutes spent reading each day: 20, 25, 25, 30, 35. Find the mean and median.
- 6
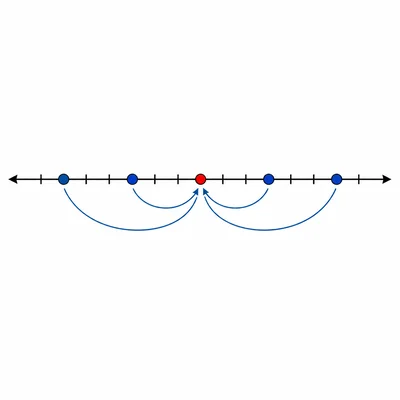
Find the mean absolute deviation, or MAD, for this data set: 2, 4, 6, 8, 10.
- 7
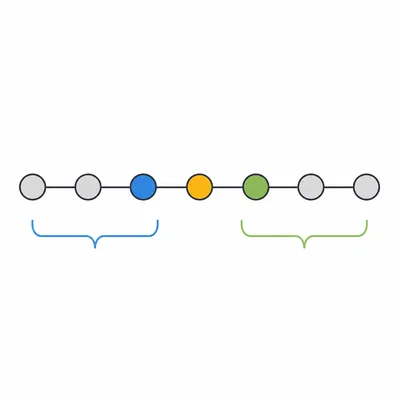
Find the lower quartile, upper quartile, and interquartile range for this data set: 3, 5, 7, 9, 11, 13, 15.
- 8
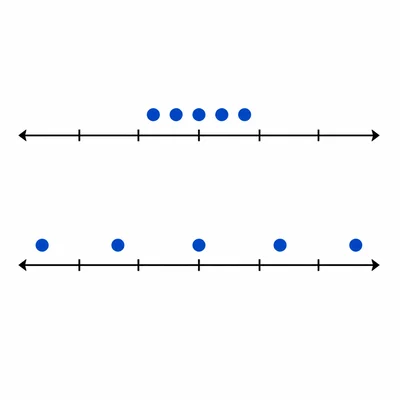
Two data sets have the same mean. Set A is 10, 10, 10, 10, 10. Set B is 2, 6, 10, 14, 18. Which set has the greater spread, and how do you know?
- 9
A basketball player scored 8, 12, 14, 16, and 20 points in five games. What is the mean number of points scored per game?
- 10
A small data set is 5, 6, 7, 8, 24. Which measure of center, mean or median, better represents a typical value in this data set? Explain.
- 11
The number of pets owned by students in a class is shown here: 0, 1, 1, 2, 2, 2, 3, 4. Find the mean, median, and mode.
- 12
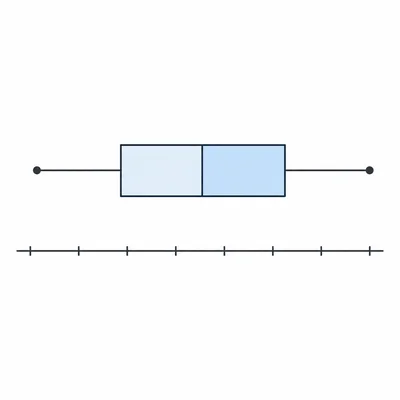
A data set has a minimum of 12, a lower quartile of 18, a median of 25, an upper quartile of 31, and a maximum of 40. Find the range and interquartile range.