NASA Climate Data Explorer
Explore monthly climatology and decadal warming trends for 20 cities around the world using a snapshot of NASA POWER reanalysis data. Pick up to four cities, compare them side by side, and identify tropical, arid, temperate, continental, and polar climate signatures.
Guided Experiment Equatorial vs Polar Climates
How different are the annual temperature ranges and seasonal patterns of an equatorial city compared with a polar station? Will both show clear summer and winter seasons?
Write your hypothesis in the Lab Report panel, then click Next.
World cities
Controls
Tip. Select up to 4 cities to compare side by side. Showing temperature.
Climate Statistics
Singapore
Singapore (1.35°, 103.82°)TropicalClassification by precipitation and temperature. Tropical matches the listed climate zone.
Data Table
(0 rows)| # | Month | Temperature(°C) | Precipitation(mm) | Solar(kWh/m²/day) |
|---|
Reference Guide
About NASA POWER
NASA POWER stands for Prediction Of Worldwide Energy Resources. It is a public dataset built from satellite observations and the MERRA-2 reanalysis model.
POWER provides global surface meteorology and solar energy data on a regular grid, used by agronomists, architects, renewable energy planners, and climate educators.
Key variables include temperature at 2 meters, precipitation, downward shortwave radiation, wind speed, and relative humidity.
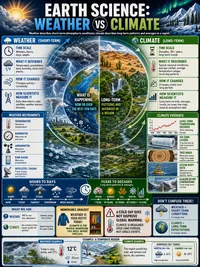
Climate vs Weather
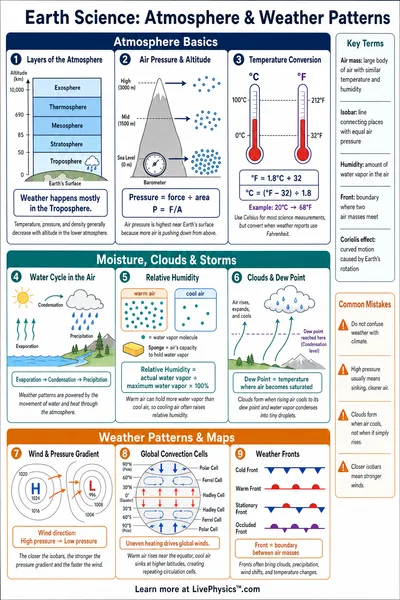
Weather describes the state of the atmosphere on a given day. Climate is the long term statistical pattern of weather, typically averaged over 30 years.
A single hot day is not climate change. A multi decade increase in the average temperature, computed from many days, is.
This lab uses monthly climatology averaged over a long baseline, which removes day to day weather noise and reveals the seasonal signature of each city.
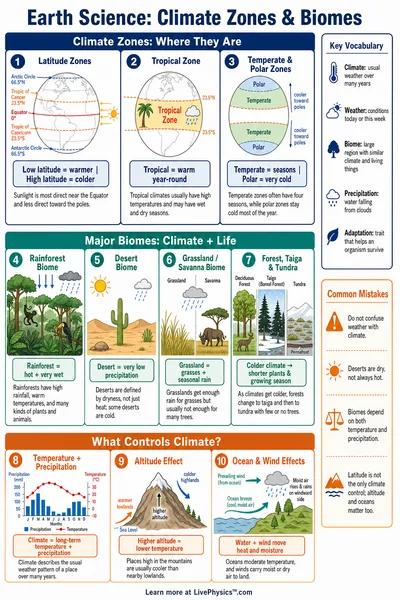
Koppen Climate Zones
The Koppen classification groups climates by temperature and precipitation patterns. This lab uses five coarse zones.
- Tropical. Hot all year, often very wet.
- Arid. Annual precipitation below 250 mm.
- Temperate. Mild winters and warm summers.
- Continental. Cold winters and warm summers.
- Polar. Mean annual temperature below freezing.
Anomaly vs Absolute Temperature
An anomaly is the difference between an observed value and a long term average, called the baseline. This lab uses the 1991 to 2020 baseline.
Anomalies are powerful for climate change detection because they cancel local effects. A station in the Arctic and one in the tropics can both be expressed as deviations from their own normal, which makes them directly comparable.
A positive anomaly means warmer than the baseline. A negative anomaly means cooler than the baseline.
Data Note
Values shown here are a static snapshot from 2025 captured from NASA POWER and published climatological references. The interactive lab does not fetch live data, so the snapshot stays consistent for classroom use.
For up to date or higher resolution data, visit the official NASA POWER portal at power.larc.nasa.gov and query a specific latitude and longitude for the period you need.