Reaction Mechanism Energy Profile Lab
Set the activation energy and the overall enthalpy change, choose a one-step or two-step mechanism, and read the potential energy profile. See the reactants, the transition state peaks, any intermediate valley, and the products on one diagram. Find the rate-determining step, compare the forward and reverse barriers, and add a catalyst to watch the reaction speed up.
Guided ExperimentExothermic vs endothermic, move the products up and down
The overall enthalpy change sets where the products sit relative to the reactants. What happens to the diagram and the reverse activation energy as you change deltaH from negative to positive?
Write your hypothesis in the Lab Report panel, then click Next.
Controls
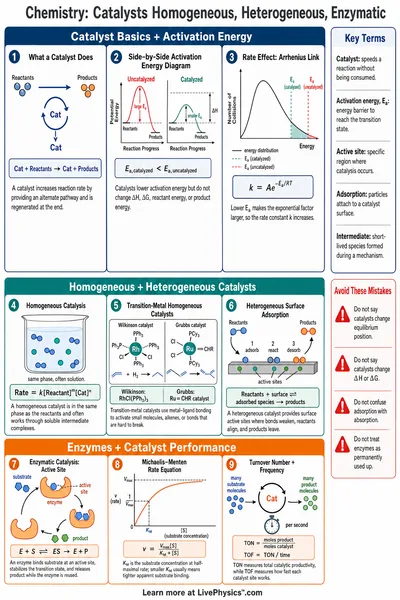
A catalyst lowers the activation energy and speeds the reaction up. It does not change Δ H or the intermediate energy.
Potential energy profile
The curve rises from reactants over each transition state and falls to the products. The red dot marks the rate-determining barrier, the highest one to climb.
Results
Overall Δ H
-50kJ/mol
Reaction type
Exothermic
Activation energy
80kJ/mol
RDS barrier (Ea)
80kJ/mol
| Step | Forward Ea (kJ/mol) | Reverse Ea (kJ/mol) |
|---|---|---|
| Step 1 (rate determining) | 80.0 | 130.0 |
Takeaways
- •With a single step, that one barrier sets the rate of the whole reaction.
- •The reaction is exothermic, so the products sit lower than the reactants.
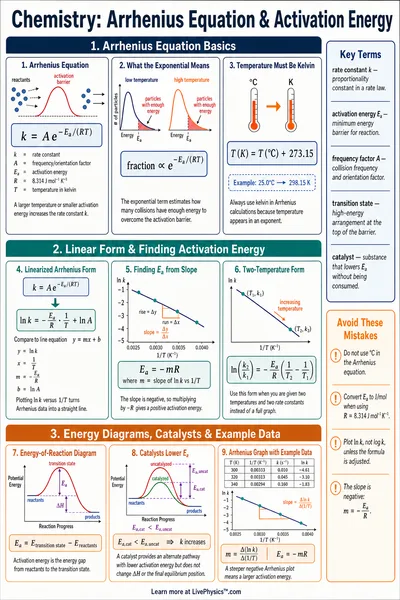
Reverse Ea equals forward Ea minus Δ H, so for this reaction the reverse barrier of step 1 is 130 kJ/mol. The relative rate uses Arrhenius, k ∝ exp(-Ea / RT), with R = 8.314 J/(mol K).
Data Table
(0 rows)| # | Mechanism | deltaH(kJ/mol) | Ea1(kJ/mol) | Catalyst(%) | RDS Ea(kJ/mol) | Speedup |
|---|
Reference Guide
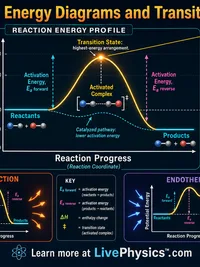
Reading an Energy Profile
A potential energy profile plots energy on the vertical axis against the reaction coordinate, the progress from reactants to products, on the horizontal axis.
- Reactants sit at the start, at the reference energy of zero.
- Each peak is a transition state, the least stable point on the path.
- Products sit at the end, above or below the reactants.
- The climb from reactants to the first peak is the activation energy.
The activation energy is the barrier the reaction must overcome. A higher barrier means a slower reaction at a given temperature.
Exothermic vs Endothermic
The overall enthalpy change, written as the difference between product and reactant energy, tells you whether the reaction releases or absorbs energy.
- A negative enthalpy change is exothermic, so products sit below reactants.
- A positive enthalpy change is endothermic, so products sit above.
- The reverse activation energy equals the forward one minus the enthalpy change.
For an exothermic reaction the reverse barrier is larger than the forward one, so the back reaction is harder to drive.
Multi-Step Mechanisms and the Rate-Determining Step
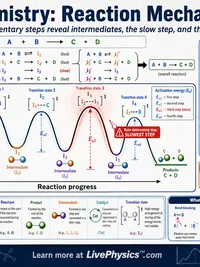
Many reactions happen in more than one elementary step. Each step has its own barrier, and a stable dip between them is an intermediate.
- An intermediate is a real species that forms and is then used up.
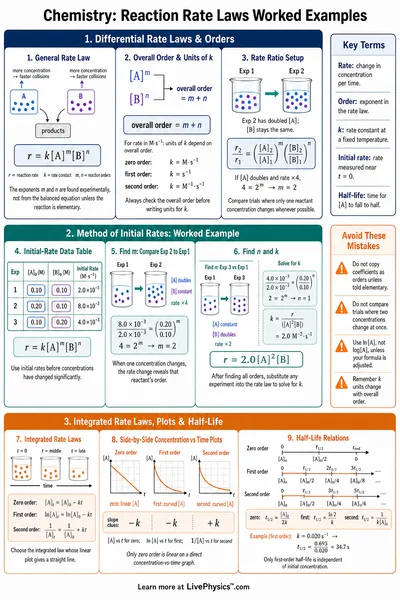
- The step with the highest barrier is the rate-determining step.
- The rate-determining step sets the pace of the whole reaction.
An intermediate sits in a valley on the profile, unlike a transition state, which sits at a peak and cannot be isolated.
How Catalysts Lower the Barrier
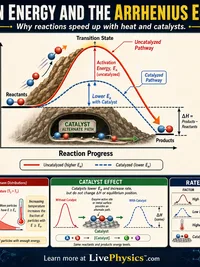
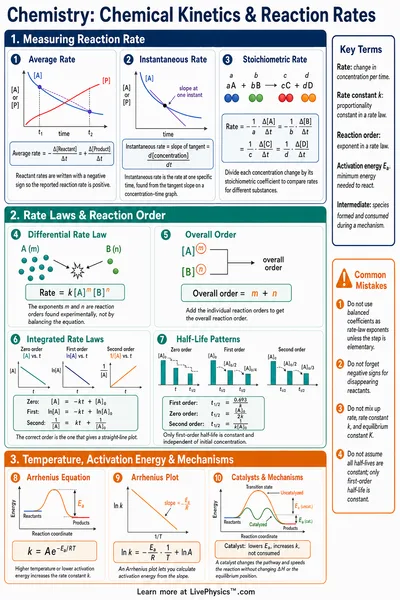
A catalyst provides an alternative path with a lower activation energy. The reaction goes faster because more molecules have enough energy to get over the smaller barrier.
- A catalyst lowers the transition state energy, not the reactants or products.
- It does not change the overall enthalpy change of the reaction.
- The speedup follows the Arrhenius factor, the exponential of the barrier drop over R T.
Because the speedup is exponential, even a modest drop in the activation energy can make the reaction hundreds of times faster.