Reaction Rate Investigation Lab
A full chemical-kinetics investigation. Test which integrated rate law best fits a concentration-vs-time dataset, derive the reaction order from initial rates, and extract activation energy from an Arrhenius plot.
Choose an Investigation
Investigation A. Order by Linearization
Which integrated rate law (zero, first, or second order) gives a straight line when applied to a single concentration-vs-time dataset?
Time t (sample at 0, 30, 60, 90, 120, 180, 240, 300 s)
Measured concentration [A] (with ±2% spectrophotometer noise)
- Initial concentration [A]_0 (held constant across one run)
- Temperature T (held constant, typically 298 K)
- Solvent, mixing, and cell path length (assumed constant)
Predict which plot will be linear. State whether you expect zero, first, or second order, and write the integrated rate law you intend to test.
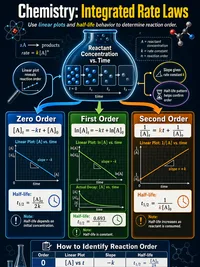
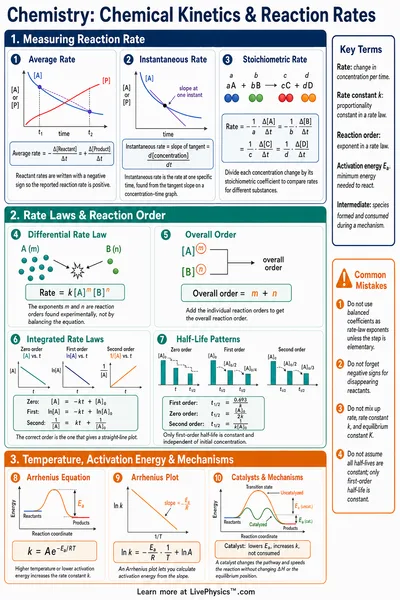
For a first-order reaction, ln[A] vs t is linear with slope -k. For zero order, [A] vs t is linear with slope -k. For second order, 1/[A] vs t is linear with slope +k. The R² of the correct linearization should exceed 0.99.
- Record 8 trials at the fixed time grid (0 s to 300 s)
- Switch the candidate linearization between order 0, 1, and 2
- Compare R² across all three linearizations; the largest wins
- Read k from the slope (-slope for orders 0 and 1, +slope for order 2)
- Reveal the true underlying order and discuss your match
Setup
Each "Record Trial" simulates one measurement with realistic noise. Investigation A walks through the time grid, B sweeps initial concentrations, C sweeps temperatures.
Reaction Setup
ln[A] vs Time t (s)
Record at least 2 trials (or load sample data) to see the regression line.
Regression & Error Analysis
Record at least 2 trials to compute the regression. For a defensible fit you should collect 6 or more trials across the full range of the IV.
Data Table
(0 rows)| # | Trial | Time t(s) | [A] measured(M) | ln[A] | 1/[A](1/M) |
|---|
Reference Guide
Investigation Workflow
A rate-law investigation needs more than one measurement. State a hypothesis, pick an independent variable, collect replicated trials, fit a linear model, and quote a final value with uncertainty.
- State a testable hypothesis about the reaction order or Ea
- Identify IV, DV, and controlled variables for the chosen method
- Record at least 6 trials across the full range of the IV
- Fit a linear model to the appropriate transformed variable
- Quote derived k, n, or Ea with uncertainty and percent error
Integrated Rate Laws
Three integrated rate laws give three different linear plots.
The plot with the highest R² identifies the order. The slope yields k (with sign -k for orders 0 and 1, +k for order 2).
Initial Rates Method
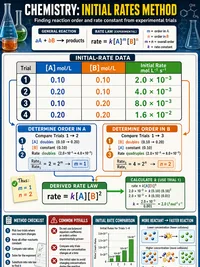
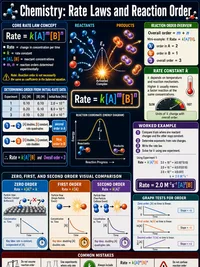
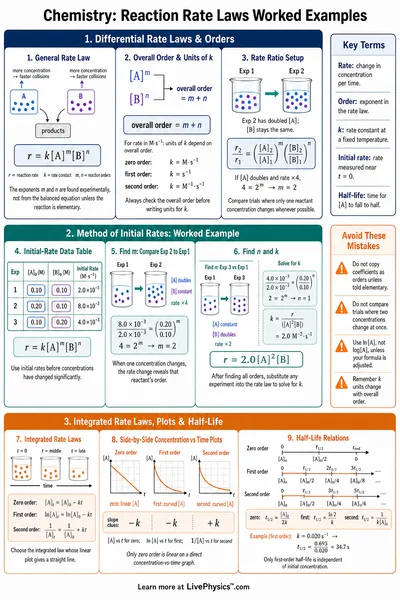
Vary the initial concentration and measure the rate at t = 0. The power-law form of the rate equation linearizes after taking a log.
The slope of ln(r_0) vs ln([A]_0) is the order n and the intercept is ln k. Use this when a single time series is too noisy to identify the order.
Arrhenius and Activation Energy
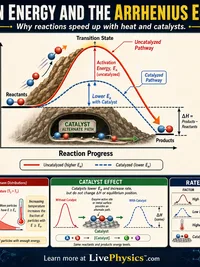
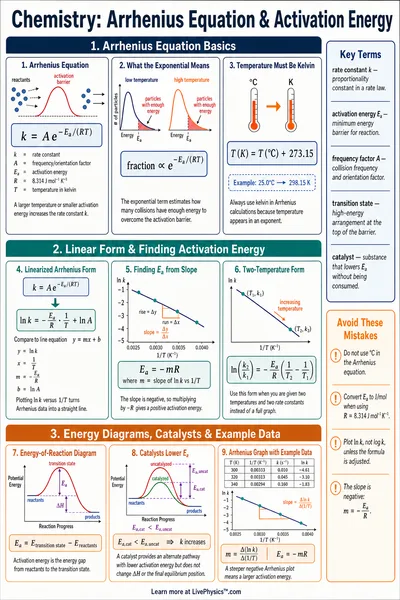
The Arrhenius equation links the rate constant to temperature.
Plot ln(k) vs 1/T. The slope is -Ea/R and the intercept is ln A. With R = 8.314 J/(mol·K), the derived activation energy is Ea = -slope · R (converted to kJ/mol).